
Figure 3.
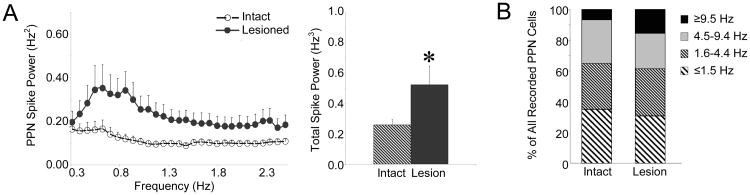
Characteristics of PPN spike trains in the urethane-anesthetized preparation. Oscillatory activity in PPN spike trains (A, n=59 PPN cells in 17 intact rats, 38 cells in 11 lesioned rats) was determined by converting PPN spike trains to Gaussian waveforms with a 20 Hz sampling rate and then using FFT to determine power in the 0.3-2.5 Hz range. There is an increase in power in the ∼1 Hz range in PPN spike trains following dopamine cell lesion (left) with a significant increase in total power between 0.3-2.5 Hz following dopamine cell lesion (right). * P<0.05 compared with intact. Firing rate distributions (B, n=59 cells in 17 intact rats, 38 cells in 11 lesioned rats) are indicated for the intact and 6-OHDA lesioned animals. There was no significant difference in firing rate between intact and lesioned rats.