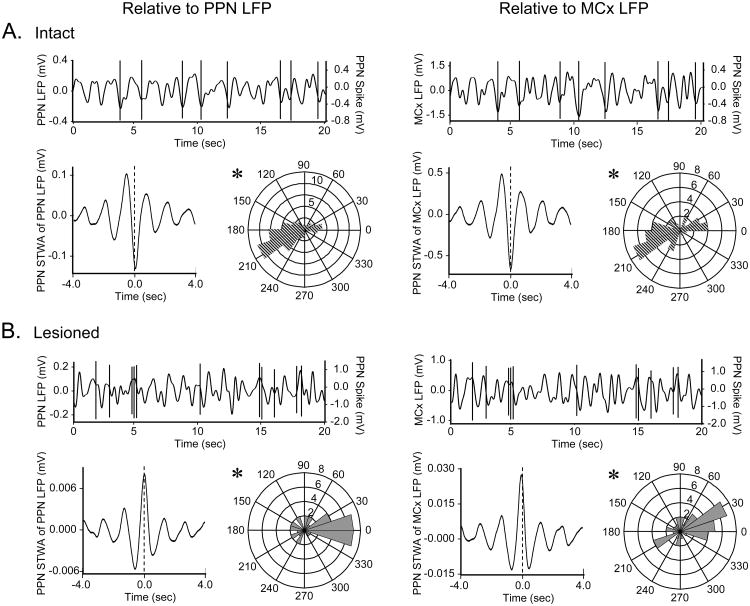
Figure 5.
PPN spike timing relative to LFP oscillatory activity in the urethane-anesthetized preparation. Typical PPN spike trains in intact (A) and lesioned (B, n=37 significantly oscillatory cells in lesioned rats) rats are shown at the top of each panel overlaid on simultaneously recorded PPN LFP (left, n=54 cells with significant peaks in their STWAs in 16 intact rats, 37 cells in 11 lesioned rats) or MCx LFP (right, n=37 cells in 12 intact rats, 39 cells in 11 lesioned rats) activity. PPN spike-triggered LFP waveform averages (lower left of each panel) illustrate the time of PPN spiking relative to the phase of LFP oscillatory activity in the example spike train. Polar histogram plots (lower right of each panel) summarize the distribution of phases of PPN spikes with respect to PPN LFP (left) and MCx LFP (right) oscillations. In the intact rat, spiking occurs at or near the trough (∼180°) of PPN and MCx LFP activity. Dopamine cell lesion significantly changes this phase relationship as PPN spiking occurs primarily at the peaks (∼0°) of LFP oscillations in lesioned rats. *Significantly (P<0.05) unimodal distributions of phase relationships between PPN spiking and LFP activity.

