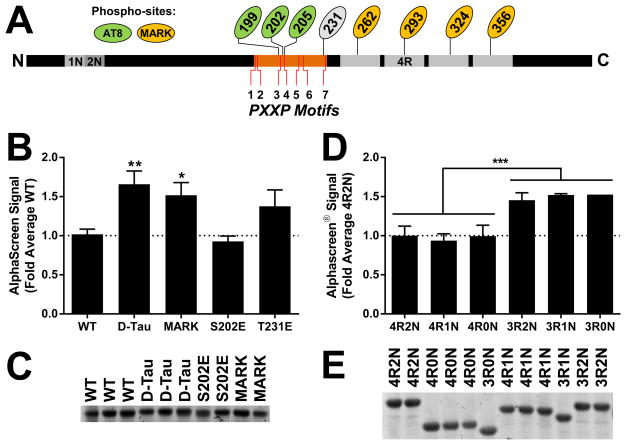
Figure 3.
The AlphaScreen Tau–Fyn SH3 assay signal is increased by Alzheimer’s disease–associated modifications in Tau and by 3R Tau. (A) Schematic diagram of Tau indicating the seven PXXP motifs in the proline-rich domain (orange) and the positions of the phosphorylation sites examined, including the MARK site (yellow) and sites in the AT8 epitope (green). (B) Pseudophosphorylation at MARK sites, alone or in combination with the AT8 epitope, increased the Tau–Fyn interaction. ANOVA, p < 0.0001; * indicates p < 0.05 and ** indicates p < 0.01 by Dunnett’s post hoc vs. WT control (n = 2–12 independent protein preparations per group). Error bars indicate SEM. (C) Representative protein concentration gel showed no difference in concentration between protein preparations used in panel B. (D) 3R isoforms of Tau showed increased Tau–Fyn SH3 AlphaScreen signal. *** indicates p < 0.001 3R vs. 4R effect by two-way ANOVA (n = 1–6 independent protein preparations per group). Error bars indicate SEM. (E) Representative protein concentration gel showing no difference in concentration between protein preparations used in panel D.

