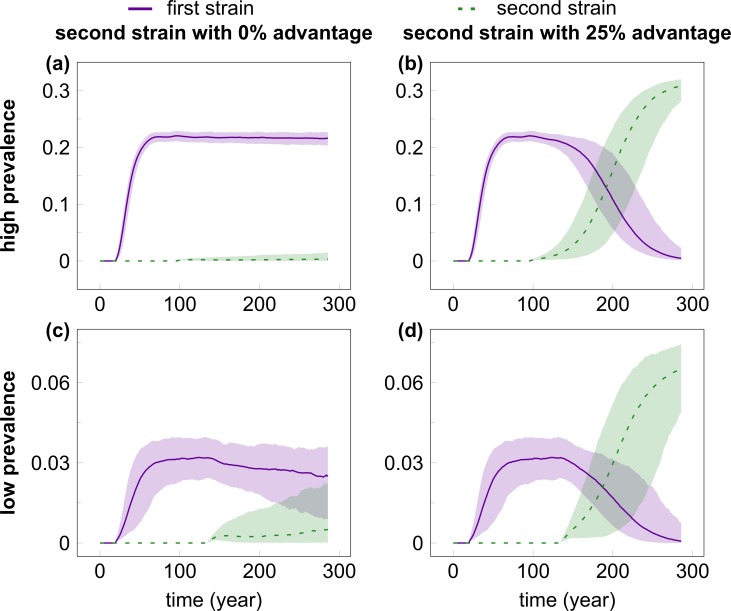
Fig 1. The time course of infection prevalence in multiple simulations of the competition of HIV strains.
The invader virus had equal (A, C) or 25% greater (B, D) transmission rate compared with the resident strain in the high (A, B) or low (C, D) prevalence scenarios. The resident strain (solid purple line) was introduced in the population at Week 1000 (to allow the network to attain steady state); the invader strain (dashed green line) was introduced in the population when the first had already reached steady-state prevalence (at Week 5000 and 7000 for the high- and low-prevalence setting, respectively). Even with a 25% advantage in the transmission rate, it took the invader strain a median of 60 and 104 years to reach the prevalence of the resident strain in the low- and high-prevalence scenario, respectively. The lines show median prevalence from simulations where the invader strain did not go extinct (out of 1000 simulation runs); shading indicates the areas between the 5% and 95% quantiles. Simulation parameters were set as in Table 1.

