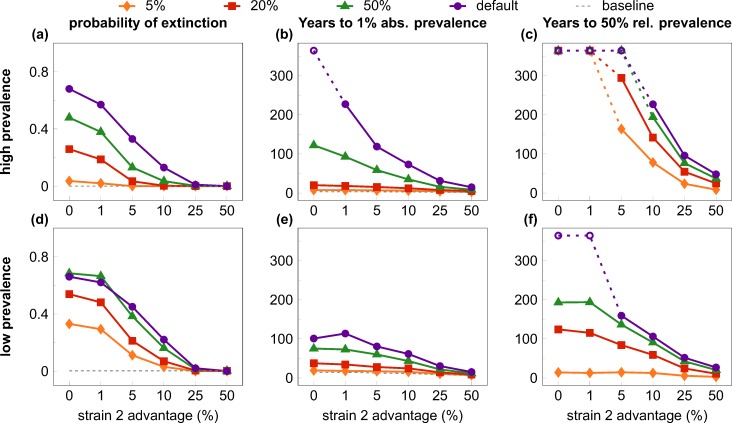
Fig 5. Quantifiers of the “first comer advantage” when the invader virus enters in the growth phase of the resident strain.
Plotted are cases (coded by symbols and colour) where the invader was introduced when the resident strain had attained 5%, 20% or 50% of its plateau prevalence; in the default case the second virus was introduced at Week 7000/5000 in the low/high prevalence setting (as in Fig. 3) when the resident strain had already reached a stable plateau in its prevalence. All quantifiers are plotted against the relative transmission rate advantage of the second (invader) strain. Rows show results from the high (top row) and low prevalence (bottom row) settings; columns depict three different quantifiers. First comer advantage is weaker when the invader enters at earlier stages of the growth of the initial strain. Dashed gray lines in A-B and D-E represent the growth of the resident virus without competition; with early introduction of the invader strain, 50% relative prevalence in C and F is attained well below plateau prevalence and therefore cannot be compared to the 50% point of single-virus epidemics as a baseline. Data in B-C and E-F depict medians from 1000 simulation runs (excluding those where the invader virus went extinct). Parameters are listed in Table 1; competition dynamics followed the default scenario in all cases. The maximum length of simulations was 19,000 weeks (~365 years); empty symbols indicate where the invader strain did not reach the threshold prevalence by the end of the simulation in the majority of the cases.

