Figure 5.

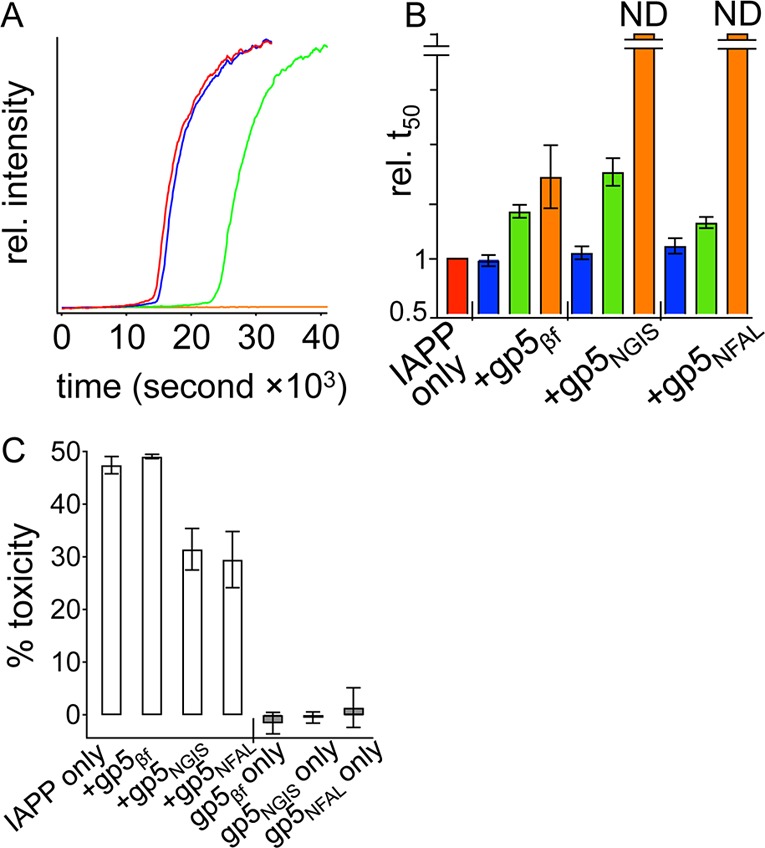
Interaction of gp5βf proteins with full-length, wild-type IAPP. (A) Data for a representative fiber formation reaction, monitored using fluorescence of 200 nM ThT, are shown with addition of 1 nM (blue), 10 nM (green), or 100 nM (orange) gp5NGIS to 50 μM IAPP. Data for the IAPP-only reaction are colored red. (B) Statistics of reaction midpoints, t50, relative to IAPP-only t50 (red) from fits to repeats of kinetic measurements such as in panel A, but using the indicated gp5βf variant. (C) Toxicity of IAPP toward INS-1 cells at 13 μM IAPP alone and with the indicated gp5βf molecule at 0.5 μM (white bars). The toxicities of the indicated gp5βf proteins alone at 0.5 μM are shown as gray bars. ND in panel B indicates no detected change after observation for 16 h.
