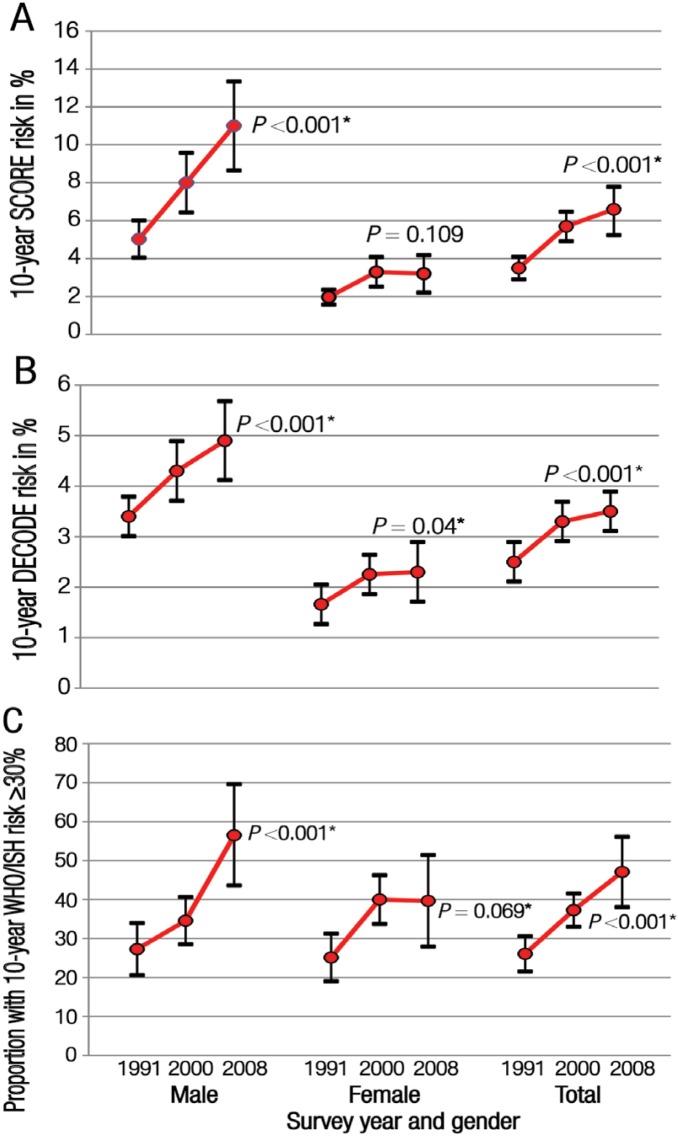
Figure 1A–C:
Estimated trends of the 10-year risk for developing cardiovascular disease among adults with diabetes mellitus in Oman by gender and year using data from three population-based national surveys.9–11 Risk prediction was calculated using the (A) Systematic COronary Risk Evaluation (SCORE), (B) Diabetes Epidemiology Collaborative Analysis of Diagnostic Criteria in Europe (DECODE) and (C) World Health Organization (WHO)/International Society of Hypertension (ISH) tools.13–15 For SCORE and DECODE, each point on the graph represents the mean for 10-year risk and the bars represent the upper and lower limits of the 95% confidence intervals.
*Significance of linear trend test.

