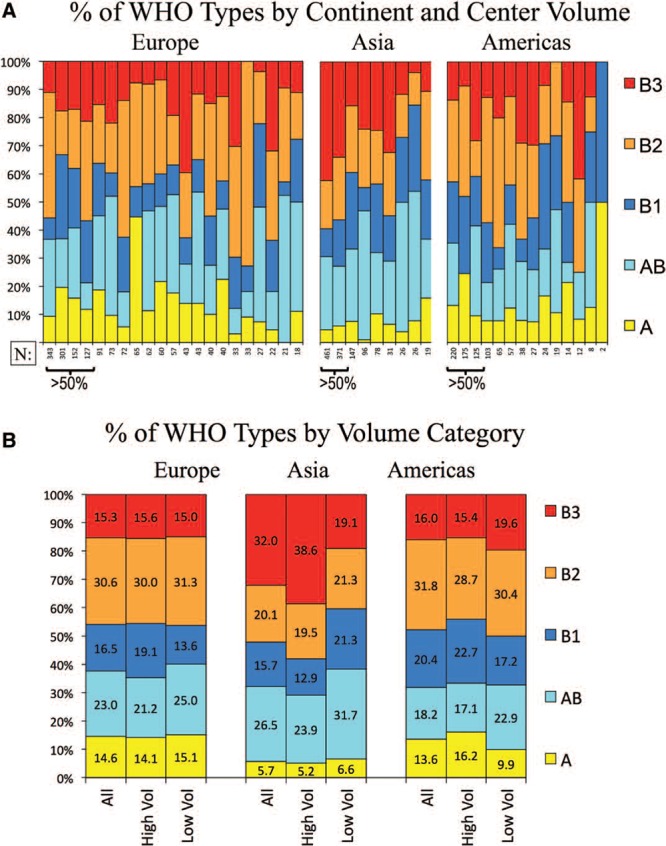
FIGURE 2.

Relative frequency of thymoma histotypes by center volume and geographic region. A, Frequency of thymoma subtypes, ordered by size of center and geographic region. B, The frequency of thymoma subtypes by region and by high- and low-volume centers. “High volume centers” are those contributing more than 50% of the total cases per region. WHO, World Health Organization.
