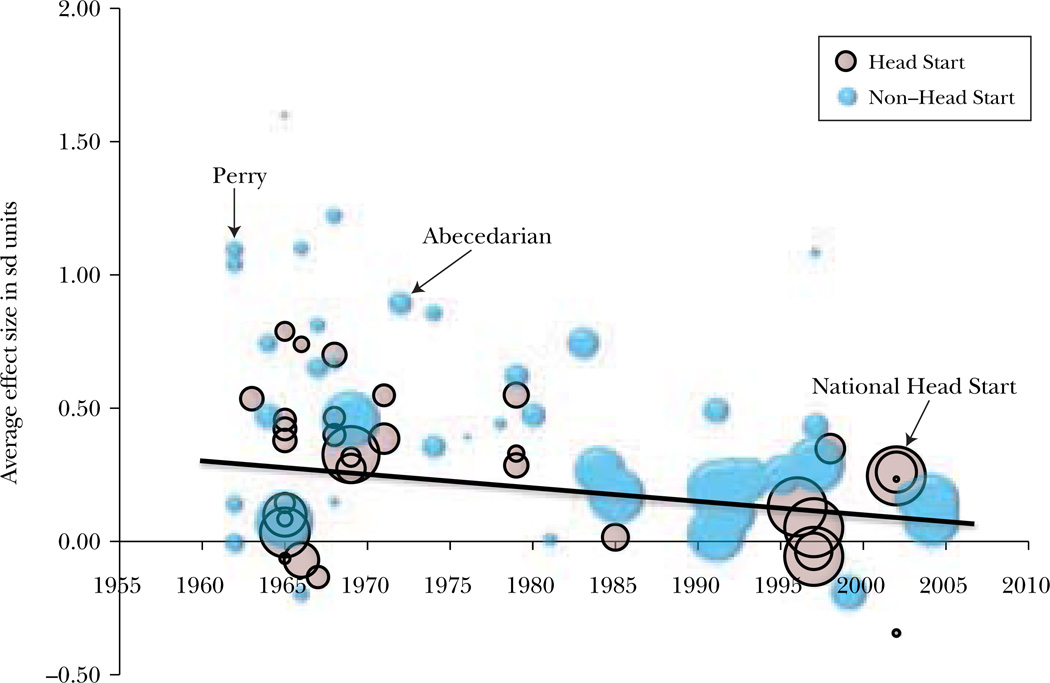
Figure 2.
Average Impact of Early Child Care Programs at End of Treatment
(standard deviation units)
Source: Authors.
Notes: Figure 2 shows the distribution of 84 program-average treatment effect sizes for cognitive and achievement outcomes, measured at the end of each program’s treatment period, by the calendar year in which the program began. Reflecting their approximate contributions to weighted results, “bubble” sizes are proportional to the inverse of the squared standard error of the estimated program impact. There is a weighted regression line of effect size by calendar year.

