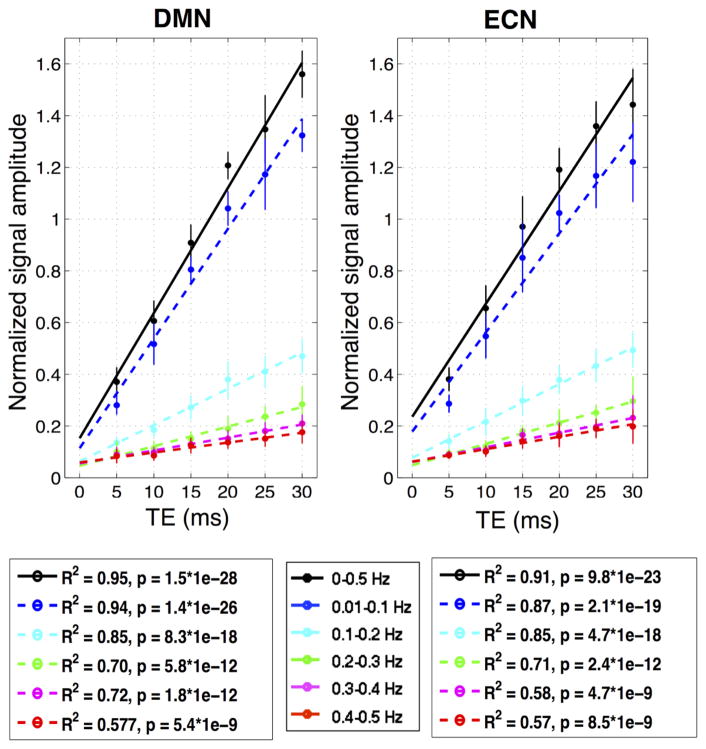
Fig. 2.
Functional connectivity signal amplitudes vs. TE. Statistics shown here are standard linear model vs. Gaussian noise tests; lack-of-fit tests were also performed and failed to reject the linear hypothesis for all frequency bands (not shown). To account for the inter-subject variability, each subject’s correlated signal amplitudes were first normalized (divided by the mean correlated amplitude across different TEs of B0 band) before group fitting.

