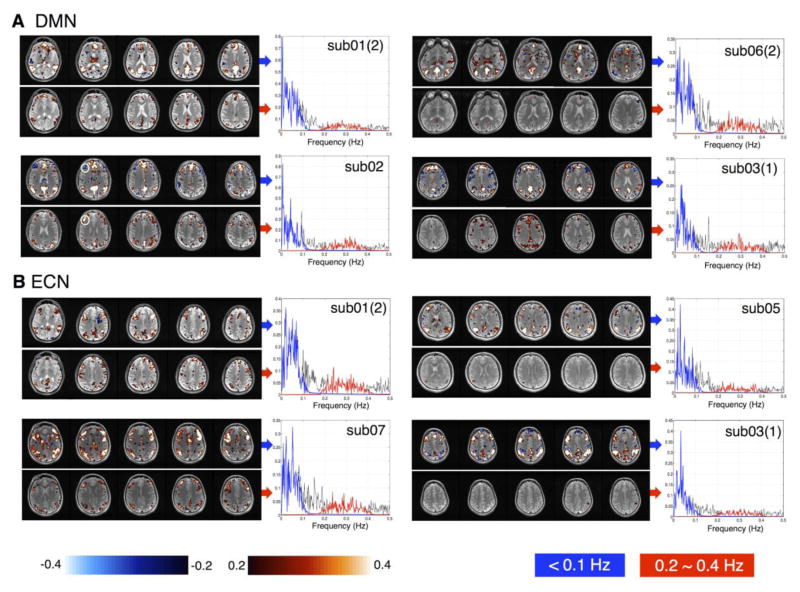
Fig. 5.
DMN/ECN patterns of representative subjects at <0.1 Hz (upper rows) and 0.2~0.4 Hz (bottom rows) (|r|>0.2, p<0.002, uncorrected). The power spectra of the chosen network seed signals at (<0.1 Hz) and (0.2~0.4 Hz) are highlighted in blue and red separately. Numbers in the parenthesis indicate the scan trial for subjects who participated twice.

