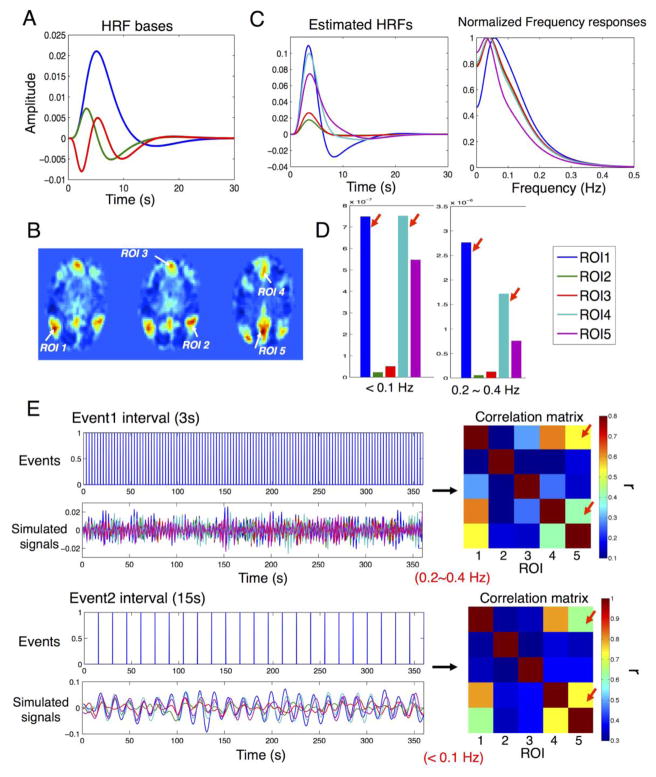
Fig. 8.
The influence of heterogeneous HRFs within a RS network on the frequency specificity of the exhibited network patterns. (A) Basis functions employed in HRF fitting: canonical HRF (blue), temporal derivative (green), dispersive derivative (red); (B) ROIs within the DMN (sub01 (2)) chosen for simulations; (C) Estimated HRFs and the normalized frequency responses; (D) Frequency specificity of signal intensity patterns (un-normalized response power of estimated HRFs in (C) integrated within the corresponding frequency bands); (E) Disparate correlation patterns of simulated signals (‘Simulated signals‘) (shown by ‘Correlation matrix’) with stimulus input (‘Events’) given at different frequency scales.

