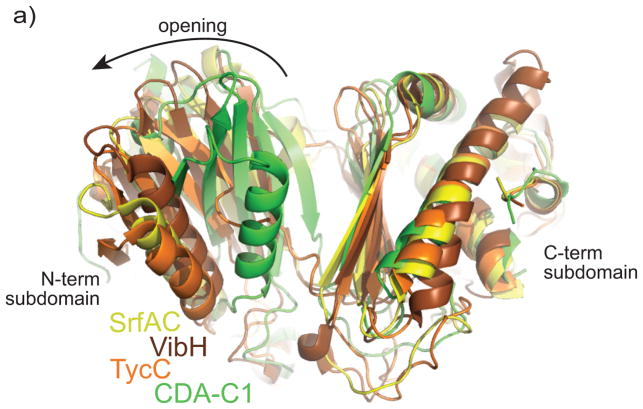
Figure 3. Comparison of CDA-C1 with other C domains.
Alignment of the C-terminal subdomain shows different relative subdomain–subdomain orientation in the structures of C domains. CDA-C1 displays the most “closed” conformation. CDA-C1 is in green, the C domain from SrfAC is yellow, from VibH is brown and from TycC is orange. See supplementary figure S4 for individual comparisons.

