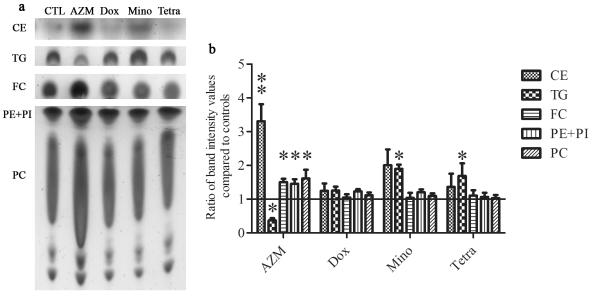
Figure 2. The effect of antibiotics on lipid composition in HMGECs.
a. Cells were treated as described in Fig. 1. Extracted lipid samples were normalized to cell numbers. b. Lipid band intensity was quantified using ImageJ. Control band instensity was set to 1 and data are reported as fold-change compared to control. **p<0.01, *p<0.05. Unlabeled bands are unidentified lipids. Band intensity analysis includes data from five independent experiments. Error bars represent the mean ± standard error. Abbreviations include free cholesterol (FC), cholesterol ester (CE), triglyceride (TG), phosphatidylethanolamine (PE), phosphatidylcholine (PC) and phosphatidylinositol (PI).

