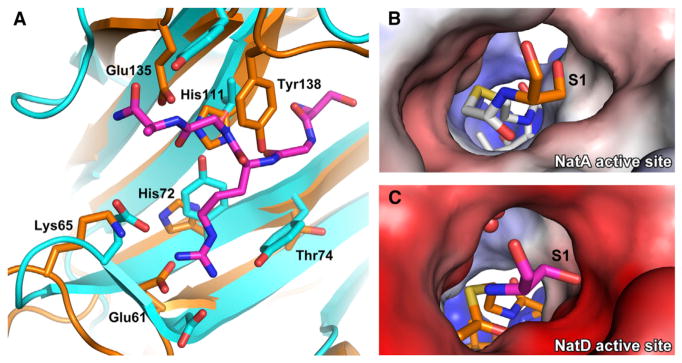
Figure 6. Comparison between Substrate Recognition of NatD and NatA.

(A) Overlay of the peptide binding site of NatA (orange) and NatD (cyan with magenta histone substrate).
(B) Electrostatic potential surface of the NatA active site with a bound covalently linked bisubstrate inhibitor. The N-terminal serine of the substrate peptide is shown in orange, and the acetyl-CoA moiety of the bisubstrate inhibitor is in white.
(C) Electrostatic potential surface of the NatD active site. The N-terminal serine of the substrate peptide is shown in magenta, and acetyl-CoA is in orange. Waters are shown as red spheres. Acetyl-CoA was modeled into the figure by aligning the binary and ternary NatD structures.
