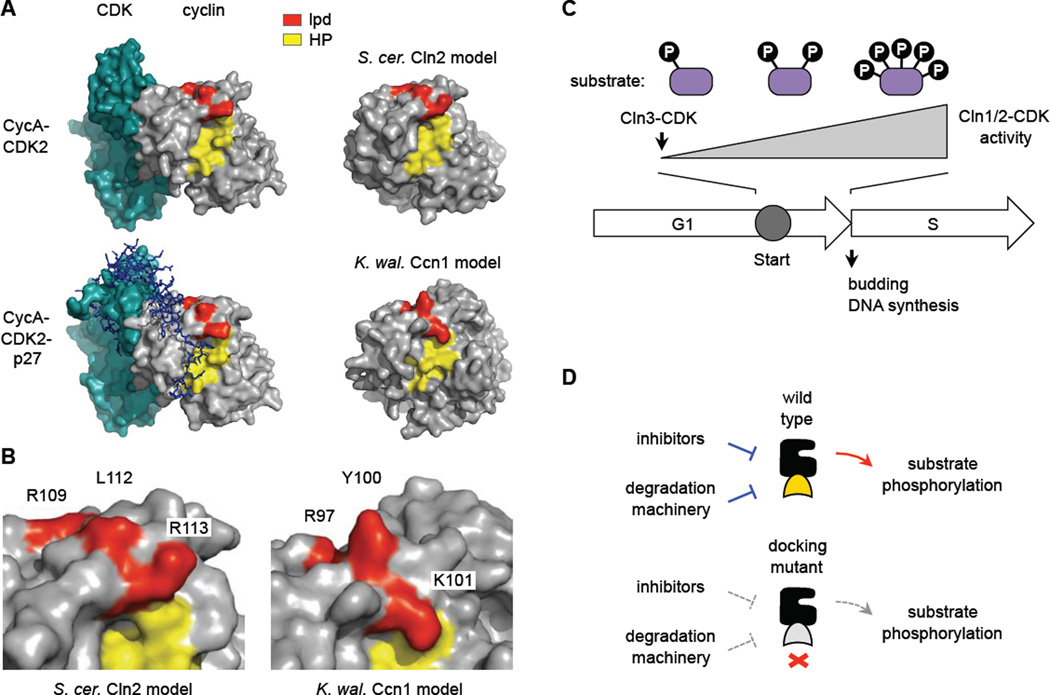
Figure 7. Docking interfaces and models.
(A) Structures of a mammalian cyclin A-CDK2 complex, with and without the inhibitor protein p27 (PDB IDs: 1H26, 1JSU), compared to models for S. cerevisiae Cln2 and K. waltii Ccn1 generated by the I-TASSER algorithm [56]. The hydrophobic patch (HP, yellow) and residues altered in the lpd mutants (red) are highlighted.
(B) Close-up of the boundary between HP and lpd regions in the predicted models, with mutated residues labeled.
(C) General model. Cln3-CDK initiates expression of CLN1/2 (and then Cln1/2-CDK further increase this expression). As Cln1/2-CDK activity accumulates, the efficiency with which it fully phosphorylates multi-site substrates may affect the duration of Start and the G1/S transition.
(D) Disruption of Cln2 docking may simultaneously disrupt both positive output and negative regulation. See text for discussion.

