
Figure 1. Adk free-energy landscape of catalysis and exploration of the phosphoryl-transfer step by X-ray crystallography.
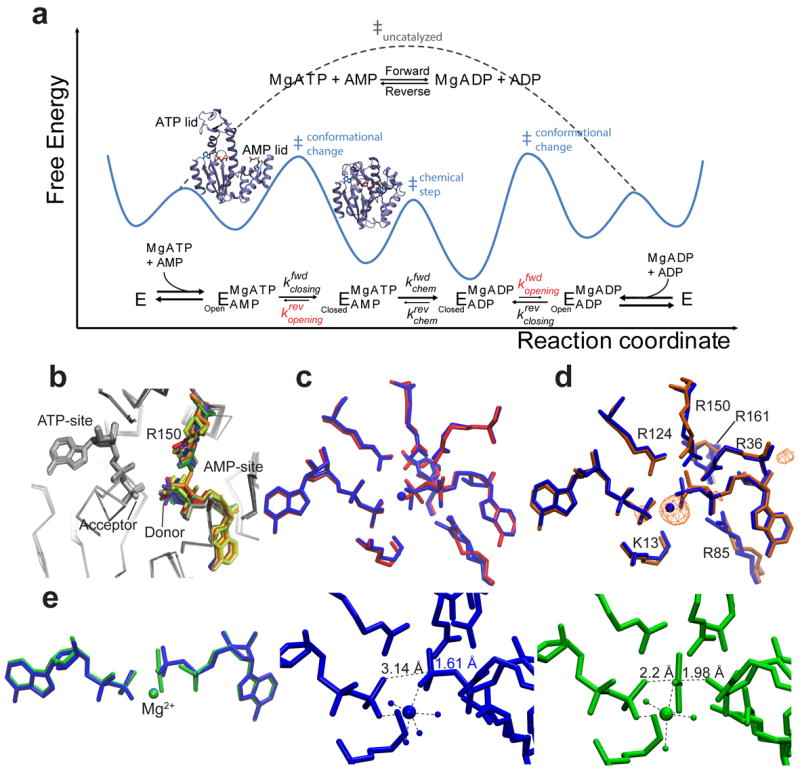
(a) Overall Adk reaction, minimal reaction scheme, and corresponding schematic of the catalytic energy landscape based on the measured enzyme kinetics (Table 2). Rate-limiting lid-opening (kopening) is shown in red and visualized by the open and closed structures. (b) The superposition of AAdk structures with ADPs bound. Conformational heterogeneity of the donor phosphate group and R150 are highlighted in color. (c) Superposition of AAdk structures with bound ADPs in the presence (PDB 4CF7, blue) and absence (PDB 4JL5, red) of Mg2+. (d) Superposition of AAdk complexed with Mg2+–ADP–ADP (blue) and Co2+–ADP–ADP (PDB 4JKY, orange). The anomalous scattering of the electron density at the Co-edge (λ=1.609 Å) is shown as anomalous difference map contoured at 5.5 σ (orange). (e) Superposition of Mg2+–ADP–AMP–AlF4– (PDB 3SR0, green) with Mg2+–ADP–ADP (blue). Detailed structures of the active site of both the substrate–enzyme complex (blue) and transition-state analogue (green) showing metal coordination and relevant O–P or O–Al distances (dashed lines) and the covalent O–P bond (blue).