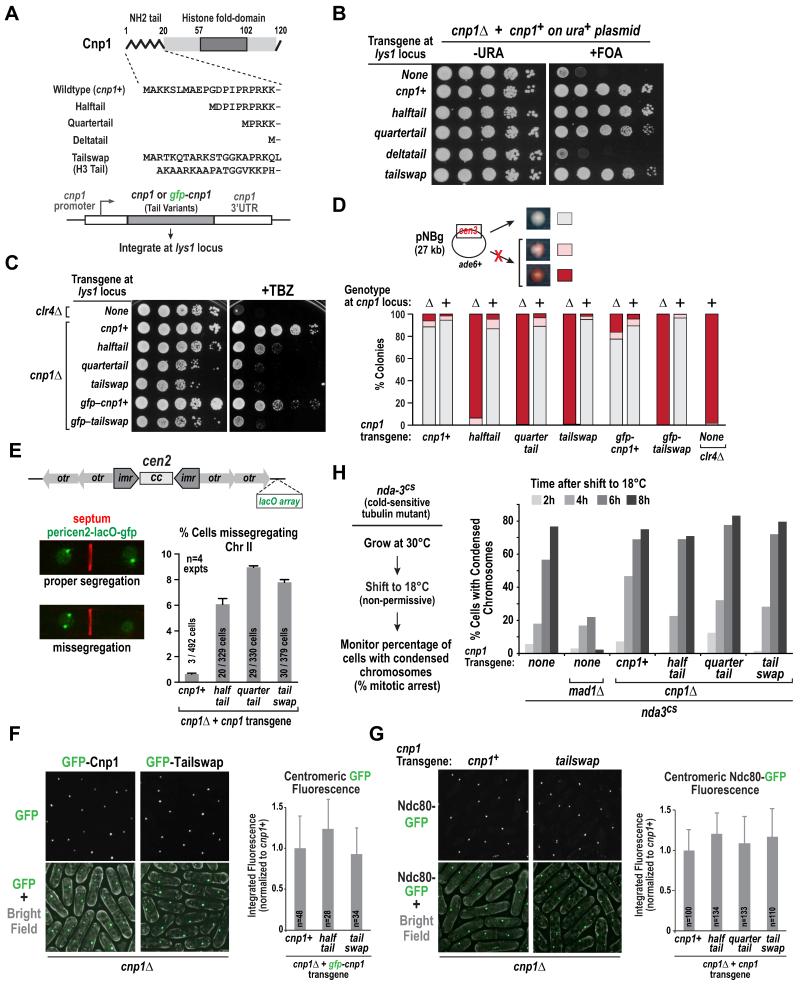
Figure 1. Cnp1 N-tail variants support viability, centromere loading, and outer kinetochore formation yet exhibit elevated chromosome missegregation.
A. Schematic of the Cnp1 N-tail variants used in this study. All transgenes were integrated at the lys1 locus.
B. Plasmid shuffle assay, employing 5-fluorooritic acid (5-FOA) to select against plasmid-encoded wild-type Cnp1, to analyze rescue of cnp1Δ cells by indicated transgenes. A ten-fold dilution series is shown for each condition.
C. Sensitivity of cnp1Δ cells expressing indicated Cnp1 N-tail variants to the spindle poison thiabendazole (TBZ). Growth was assayed at 30°C using 10-fold serial dilutions plated on rich YES medium with (right) or without (left) 10 μg/ml TBZ. clr4Δ serves as a TBZ-sensitive control.
D. Minichromosome (pNBg) maintenance assay in wildtype and cnp1Δ (indicated as + or Δ, respectively) cells expressing Cnp1 N-tail variants. clr4Δ serves as a control with elevated missegregation. Cell with a minichromosome generate white colonies; minichromosome loss results in red or sectored colonies. >900 colonies were scored per condition.
E. Segregation of Chr II marked with a pericentromeric LacO array labeled with LacI-GFP (pericen2-lacO-gfp). Septation was determined by calcofluor staining. Error bars are 95% confidence interval. Scale bar is 3 μm.
F. Images of cnp1Δ cells expressing GFP-tagged Cnp1 or Tailswap (left). The graph (right) plots the mean signal intensity of the GFP centromeric focus measured in large (lateG2) cells, normalized relative to wild-type GFP-Cnp1, for the indicated variants. Error bars are the standard deviation. Scale bar is 5 μm.
G. Images of Ndc80-GFP in cnp1Δ cells expressing untagged Cnp1 or Tailswap. The graph (right) plots the mean signal intensity of the Ndc80-GFP centromeric focus measured in large (late G2) cells of the indicated variants, normalized relative to wild-type Cnp1. Error bars are the standard deviation. Scale bar is 5 μm.
H. (left) Assay used to monitor spindle checkpoint-dependent arrest. Cold-sensitive nda3-KM311 (nda3cs) strains, containing indicated deletions and integrations, were grown at 30°C, shifted to non-permissive 18°C, and samples were fixed and processed for DAPI staining every 2 hours for 8 hours. (right) Graph plotting the percentage of cells with condensed chromatin, a marker for mitotic arrest, at different times following shift to the non-permissive temperature.

