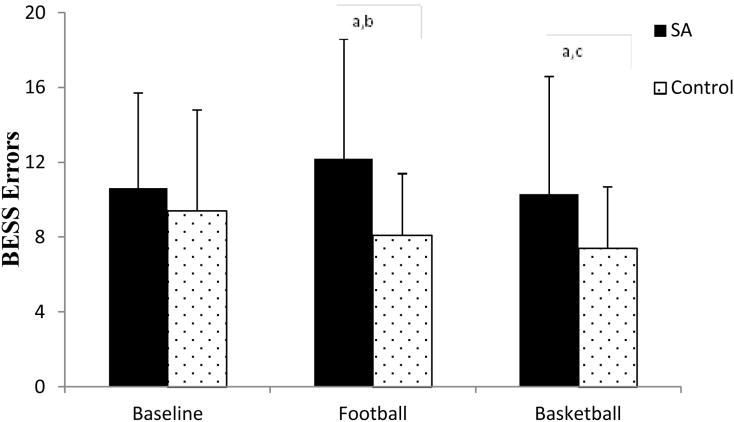
Figure 3.
BESS Performance by Environment. aThere were significant differences between groups at Football (SA: 12.2 ± 6.4 errors and control: 8.1 ± 3.3 errors; P=0.001; d=0.64) and Basketball (SA: 10.3 ± 6.3 errors and control: 7.4 ± 3.3 errors; P=0.015; d=0.46), but not at baseline (P=0.33). bThere were significant differences between Baseline and Football for both the SA group (Baseline: 10.6 ± 5.1 errors and Football: 12.2 ± 6.4 errors; P= 0.028; d=0.31) and the control group (Baseline: 9.4 ± 5.4 errors and Football: 8.1 ± 3.3 errors; P=0.05; d=0.24). cThere was a significant difference between Baseline and Basketball for the control group only (Baseline: 9.4 ± 5.4 errors and Basketball: 7.4 ± 3.3 errors, P=0.005; d=0.37).

