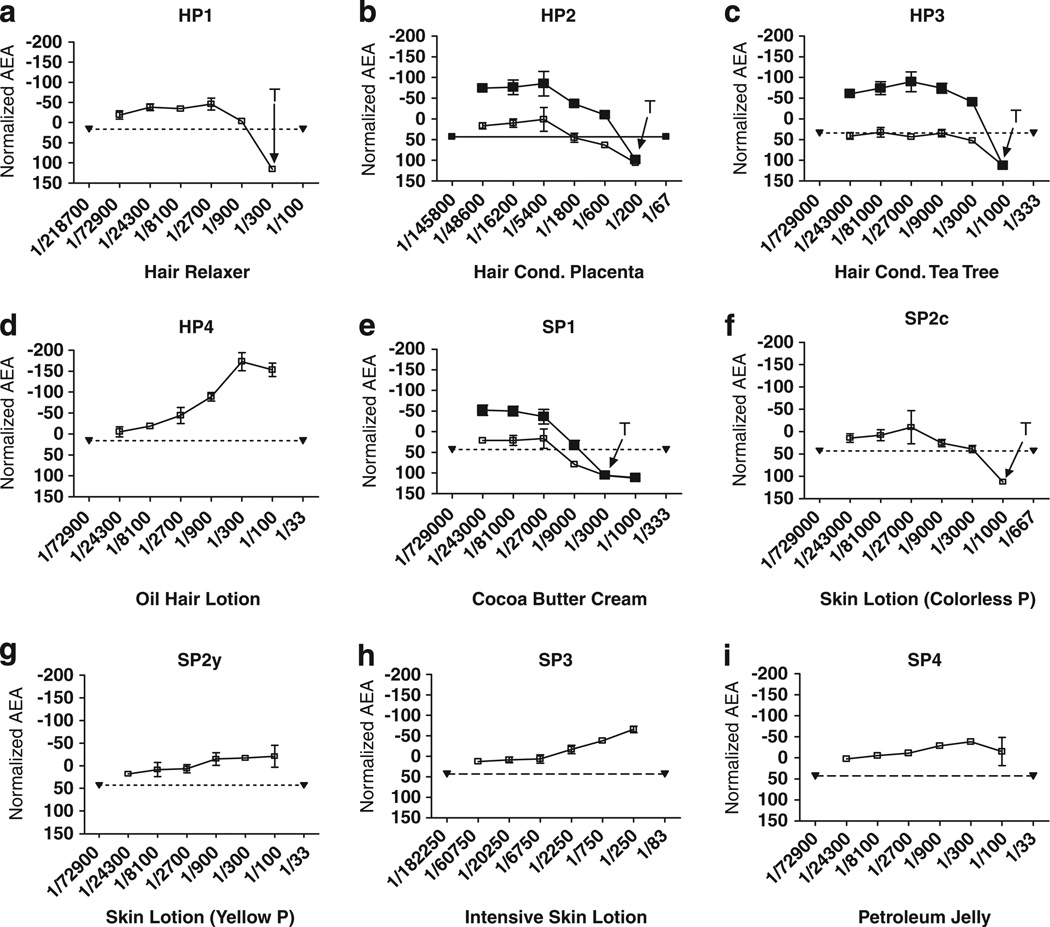
Figure 3.
(a–i) Dilution–response curves for AEA for each of four Hair or four Skin Product extracts, based on the normalized mean ± SD of three wells on the same plate. (SD is often so small that error bars are hidden by the symbol plotting the mean). Ordinate: normalized AEA response (%RMICI); Abcissa: extraction dilution. Panels b, c & e show AEA Confirmation Assays for these products having detectable AEA. Filled downward triangles joined by dotted line: low E2 + 3SD. Unfilled squares and solid line: AEA concentration–response curve for extracts plus low E2. Filled squares and solid line: concentration–response curve for extract plus high E2 to confirm that anti-estrogenic activity of the extract is reversed by adding a higher concentration of E2. T: concentrations exhibiting cytotoxicity by visual observations.

