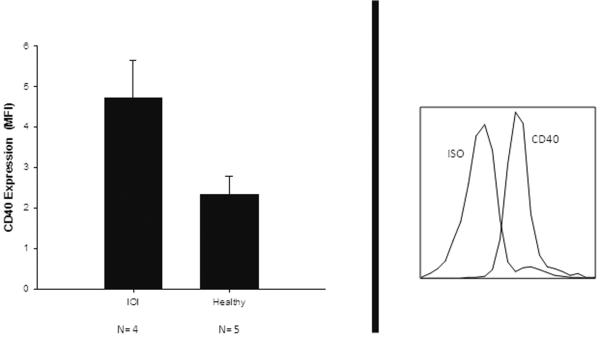
Figure 4.
Increased CD40 surface expression on blood derived fibrocytes from IOI patients compared to healthy controls. Left panel (IOI MFI= 4.71 +/− 0.94, n=4 vs. healthy MFI=2.33 +/− 0.45, n=5, p= 0.001). Mean fluorescence intensity (MFI) analyses and calculated by flow cytometry. Representative flow cytometry histogram from an IOI patient showing CD40 expression, left panel. Isotype antibody control (ISO).

