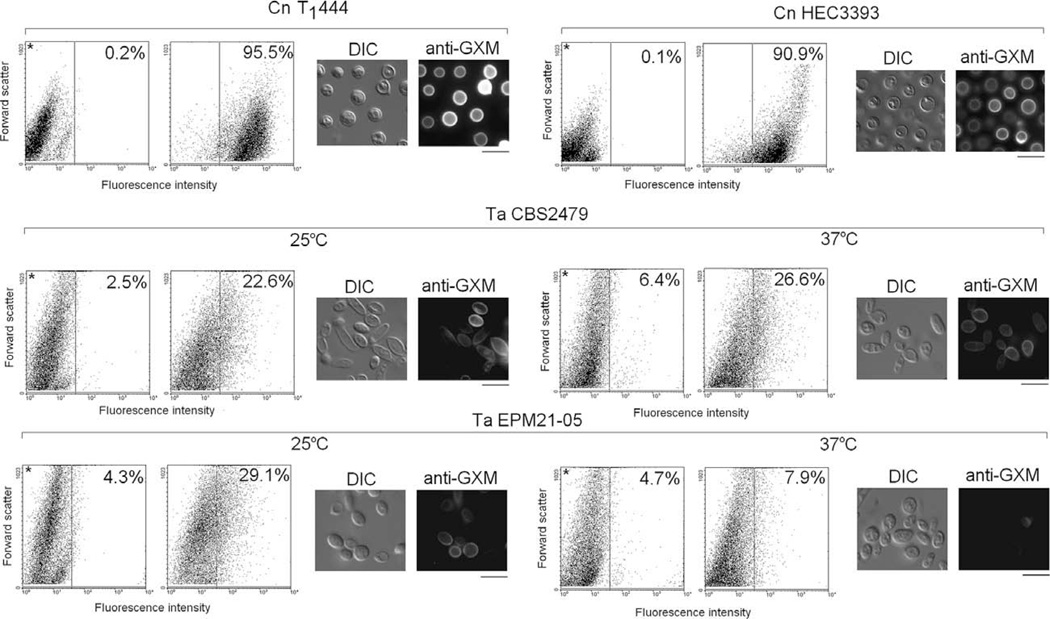
Fig. 4.
Surface expression of GXM in T. asahii (Ta) and C. neoformans (Cn). Flow cytometry and fluorescence microscopy of fungal cells indicated that mAb 18B7 reacts with most of the C. neoformans cells, while the T. asahii population is only partially recognized by the antibody. The intensity of the fluorescent reactions with cryptococci is also higher. Polysaccharide expression by the Ta isolate EPM21-05 is apparently down modulated at 37 °C. In flow cytometry dot plots, asterisks denote control systems, in which fungal cells were not incubated with the anti-GXM antibody. The percentage of fluorescent cells is shown for each system. In fluorescence microscopy panels, fungal cells observed under differential interferential contrast (DIC) and fluorescence mode (anti-GXM) are shown. Scale bars, 5 µm.

