
Figure 2.
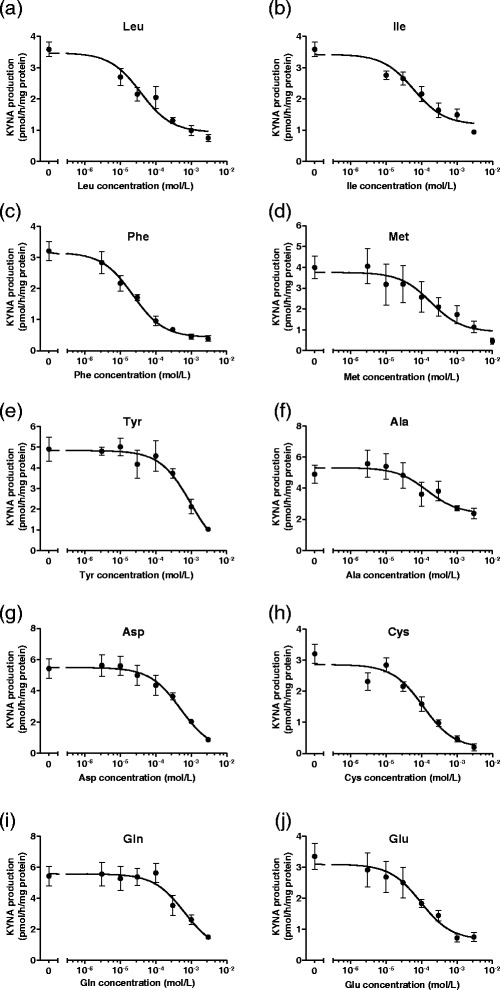
Dose-dependent inhibition of KYNA production in tissue slices from the cerebral cortex by (a) leucine (Leu), (b) isoleucine (Ile), (c) phenylalanine (Phe), (d) tyrosine (Tyr), (e) methionine (Met), (f) cysteine (Cys), (g) aspartate (Asp), (h) glutamine (Gln), (i) alanine (Ala), and (j) glutamate (Glu). Experiments were performed as described in the text using 2 μmol/L KYN. KYNA was measured in incubation medium. Values are expressed as mean ± SE (n = 4–6). Sigmoid curves were generated by nonlinear regression analysis using Graph Pad Prism 5.0.