
Figure 5.
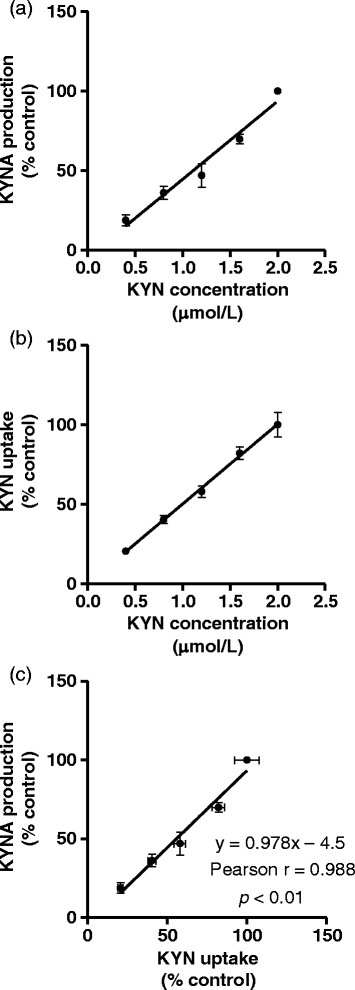
Effect of KYN on (a) KYNA production and (b) KYN uptake in tissue slices from the cerebral cortex, and (c) correlation between KYNA production and KYN uptake. Values are expressed as mean ± SE (n = 3). Lines represent linear regression of data.