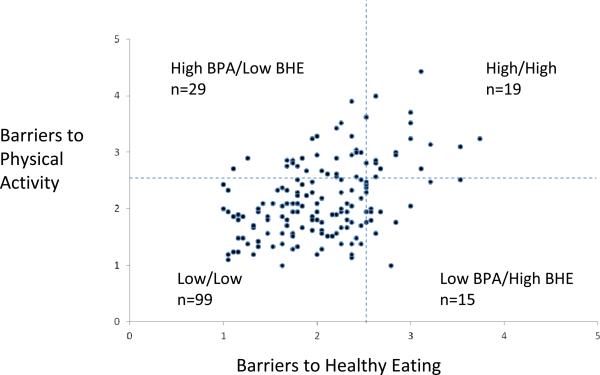
Figure 2.
Subgroups of young breast cancer survivors categorized by level of barriers to healthy eating and barriers to physical activity. Participants (n=162) are graphed according to their mean response on the barriers to physical activity scale (BPA) and the barriers to healthy eating scale (BHE). For each scale, the following categories apply: 1=never, 2=rarely, 3=sometimes, 4=often, 5=very often. A mean response of 2.5 or higher for each scale was classified as “high” whereas a response of less than 2.5 was classified as “low.”

