Abstract
Background
Several treatments for alcohol dependence have been tested in randomized clinical trials, giving rise to systematic reviews with a network of evidence, or mixed treatment comparisons, structure. Within the network, there are few direct comparisons of active treatments. Thus far, this network has not been adequately analyzed. For example, “indirect comparisons” between treatments (e.g., the comparison of treatments B:C obtained via estimates from A:B and A:C trials) have not been incorporated into estimates of treatment effects. This has implications for the planning of future randomized controlled trials.
Methods
We apply recent developments in Bayesian mixed treatment comparisons (MTC) meta-analysis to analyze the network of evidence. Using these results, we propose a methodology to inform, design, and power a hypothetical trial in the context of an updated meta-analysis, for treatments that have been infrequently compared, and therefore whose effects sizes are not well informed by meta-analysis.
Results
MTC meta-analysis provides more accurate estimates than pairwise meta-analysis and uncovers decisive differences between active treatments that have been infrequently directly compared. Weighting across all outcomes indicates that combination (naltrexone+acamprosate) treatment has the highest posterior probability of being the “best” treatment. If a new clinical trial were to be performed of combination therapy versus acamprosate alone, there is no feasible sample size that would result in a decisive meta-analysis.
Conclusions
MTC meta-analysis should be used to estimate treatment effects in networks where direct and indirect evidence are consistent, and to inform the design of future studies.
Background
Alcohol dependence is an important health risk factor that can lead to disability and death. Alcohol consumption is potentially avoidable, and effective strategies to help people who are dependent on alcohol to reduce excessive drinking and maintain abstinence following detoxification are needed. Several treatments have been tested in randomized controlled trials (RCTs) with various comparators of interest; thus, evidence synthesis strategies are needed for both decision-making, and planning new research studies based on the existing body of RCT literature.
The clinical practice guidelines that inform medical decision-making should rely on evidence-based evaluations of treatment options, primarily systematic reviews of randomized controlled trials (RCTs). 1 Several systematic reviews of RCTs for pharmacological treatments for alcohol dependence have been conducted. 2-6 Very recently, two systematic reviews were published in the Cochrane data base,7,8 which represents the pinnacle of evidence synthesis. Cochrane reviews naturally give rise to a mixed treatment network of evidence structure (more technically termed an incomplete randomized block design of trials). Within a network, ‘direct evidence’ refers to evidence about 2 treatments that have been directly compared (e.g., A:B), while ‘indirect evidence’ refers to evidence about 2 treatments obtained from comparisons via a common comparator (e.g., the evidence for A:B derived from A:C and B:C trials).9 There is a growing body of literature termed ‘mixed treatment comparison’ (MTC) meta analysis10-16 or ‘network meta-analysis’, where the objective is to combine all available evidence into an internally consistent set of estimates while respecting the randomization. The role of MTC synthesis is particularly clear in medical decision making where a choice must be made on which of several treatments to adopt in national treatment recommendations, which treatments to further study, and how to design those studies.
The goal of this paper is to assimilate the existing network of evidence using Bayesian MTC methods, and based on the findings, outline a methodology that could be followed to design a new trial. We first assess the assumptions of MTC, such as evidence consistency across direct and indirect comparisons.17-19 We then report and compare the resulting MTC estimates with those obtained from pairwise meta-analysis, and demonstrate improved efficiency of the MTC estimates. We present an overall ranking system weighted across the four outcomes of interest, to arrive at the “best” treatment. Finally, we use results and predictions from the Bayesian MTC model in a novel way to guide the planning of a hypothetical trial for treatments infrequently directly compared that takes into account the entire existing network of evidence.
Methods
Data
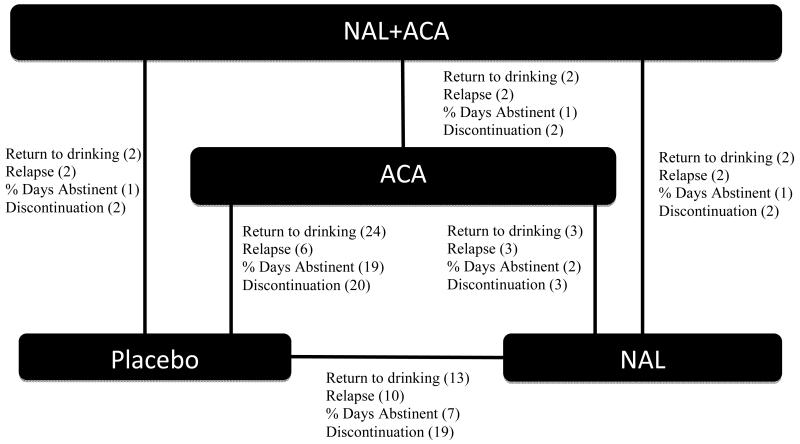
Two Cochrane database systematic reviews of naltrexone (NAL) and acamprosate (ACA) have been performed and updated as of 20087 and 2011,8 respectively. Figure 1 shows the RCT network structure where the bracketed number represents the number of trials reporting each outcome as extracted from the Cochrane Database for the return to drinking outcome only. The network demonstrates that all direct comparisons have been studied, but naltrexone and acamprosate have only been directly compared three times, and their combination has only been directly compared to placebo twice. For additional information, the reader is referred to Table 1 in the Supplementary Material, which presents summary data from each trial in the multi-arm network. Given that there are only 3 direct comparisons of ACA versus NAL in the literature, results for this comparison have been equivocal, i.e., neither treatment has been shown via pairwise meta-analysis to be superior. In addition, given only 2 direct comparisons of combined NAL+ACA with any treatment, no significant effects have been found. Since few studies consider direct comparisons of active treatments, it is essential that meta-analysis incorporate the plethora of indirect comparisons.
Figure 1.
Mixed Treatment Comparisons Model
We perform a random effects mixed treatment comparisons meta-analysis for the randomized controlled trials reported in the Cochrane database. All outcomes are modeled independently (univariately). We use a Bayesian hierarchical framework to model three binary outcomes, relapse, return to drinking, and discontinuation (R, RD, and D, respectively) and one continuous outcome, percent days abstinent (PDA). We use odds ratio to summarize the binary outcomes R, RD, and D, and mean differences to summarize PDA.
For the binary model, let the total number of events in the ith study for intervention k be denoted by yik, and the corresponding number of patients be denoted by nik. The probability of an event (pik) is given based on the observed number events in each study arm. We use the logistic regression difference parameterization of Lu and Ades 17 whereby each study, i, is assigned a reference intervention arm, b, and the corresponding log-odds for that intervention is denoted μib. The parameter δibk denotes the ith trial log odds ratio for intervention k relative to intervention, b, where δibk is assumed to be normally distributed with pooled mean treatment effect, dbk, and common (homogeneous) variance, σ2. The odds ratio model can be expressed as,
Where pik is the probability of an event in trial i under treatment k and. Taking treatment A as the overall MTC baseline, all relative treatment effects can be written in terms of the following basic parameters, the consistency equations, 17
We estimate the posterior densities of the parameters of interest using MCMC methods implemented in freely available WinBUGS software.19,20 We adapt the WinBUGS code presented in 21,22(program 1c for binary outcomes and 5a for normal outcomes). We specify vague prior distributions for all the parameters, allowing the data to drive inference. Specifically, we assign each μi and di to be N(0,10000), which are essentially quite vague though proper. For the log odds ratio model we assign the common standard deviation, σ, a Uniform (0,5) prior, which is assumed to be the same for all pairwise comparisons. This prior distribution provides the appropriate weight to the possibility of small or zero variance. For the continuous outcome (percent days abstinent), we use the specification of program 5a,22,23 with a normal likelihood, identity link, and normal random effects (we refer the reader to the original paper for the model set up). We specify the prior distribution for between trial variance as a Uniform(0, 10). For each outcome, we also graphically assess model sensitivity to other prior distributions.
Mixed Treatment Comparison Model Evaluation
To assess model convergence we use trace plots and the Brooks-Gelman-Rubin statistic. For each analysis we run two chains, each employing 40,000 iterations burn-in and monitoring an additional 40,000 iterations, basing posterior inference on every second sample to reduce autocorrelation in the sample. Thinning is chosen based on the observation of autocorrelation plots with the goal of minimizing autocorrelation in the resulting chain.
When carrying out MTC meta-analysis, it is essential to first check the consistency of direct and indirect sources of evidence using a hypothesis testing framework. We assess consistency based on both “node splitting” and the deviance information criteria (DIC). 18,24 Node splitting separates evidence available for a particular treatment comparison (i.e., node in a directed acyclical graph, DAG) into ‘direct’ and ‘indirect,’ 18 and the conflict between direct and indirect evidence sources is measured by comparing their posterior distributions. Using the methods of 18 we obtain the posterior mean treatment effect dA, Bdir, from the pair-wise meta-analysis of the trials comparing A and B directly, and obtain dA, Bindir from the MTC meta-analysis of the remaining studies, (i.e., trials including A and C and the trials including B and C). Note that the underlying model of node-splitting is the same as the model presented in the Methods, except that the trial-specific LORs δA, B are assumed to be drawn from N(dA,Bdir, σ2) and N(dA,Bindir, σ2) for the direct and indirect evidence, respectively. We then examine the posterior distribution of the inconsistency parameter, ωA,B = dA,Bdir − dA,Bindir to determine whether the data satisfies the evidence consistency null hypothesis, H0: dA,Bdir = dA,Bindir (i.e., that direct and indirect effect sizes arise from the same distribution). This is accomplished by fitting the model and using MCMC results to compute the proportion (prob) of times ωXY > 0 in the sample. The reported p-value for the hypothesis test of evidence consistency obtained by node splitting is p= 2 × min(prob,1-prob). As a second evidence consistency check, we compare the DIC resulting from the full MTC model to that resulting from the node-split models; a reduced DIC for the node split model signifies a potential inconsistency between the direct and indirect sources of evidence on that node. Although DIC has no meaningful scale, typically differences of 5-10 (smaller is better) signal an improvement in fit, and this is how we interpret model comparisons in this paper. 24
For each outcome we also compare Bayesian MTC meta-analysis posterior mean effects and 95% credible intervals (CIs) with those from Bayesian random effects pairwise meta analyses of head to head (direct) comparisons. For the outcomes relapse, return to drinking, and discontinuation, all results are presented in terms of posterior odds ratios (OR) (95% CI) where a value > 1 indicates a worse outcome. For percent days abstinent, results are reported in terms of posterior mean difference in percent days abstinent (95% CI). In general, a decisive or “significant” effect corresponds to a 95% credible interval excluding 1 for ORs and 0 for mean differences. As in Ades et al (2011),25 we report the standard deviation (σ) and its 95% CI, the posterior mean residual deviance, the effective number of parameters, and the DIC for each MTC model.
Planning a new trial
The effect size used to generate the sample size for new trials is typically derived from observed effect sizes from previous clinical or preclinical trials, or at best, from a reported meta-analysis. This effect size is then used to power the trial in isolation of accumulated evidence. However, the empirical distribution of observed meta-analysis effect sizes should not be used to plan future trials since this distribution of estimates is overdispersed. New research suggests that basing the sample size of a future trial on the results of an updated meta-analysis that will include it, is more sensible than powering a future trial in isolation.26
Posterior distributions of effect sizes and posterior predictive distributions for a new observation are natural consequences of Bayesian estimation and sensible tools on which to base future studies. A predictiveeffect size, δbk(new), can be generated and given a fixed baseline group effect size, used to generate a new observation, yik(new), from a fixed sample size. However, no closed form expression for this distribution exists and hence sampling from it within a simulation framework such as that offered by Bayesian MCMC methods would appear to be the most straightforward.
We apply the following approach in the MTC meta-analytic setting adapted from (21) for planning a 2 arm RCT with equal patient allocation and binary outcome based on odds ratios, and testing H0: δbk = 0 versus H1: δbk is not equal to 0:
While fitting the MTC meta-analysis in WinBUGS, generate an estimate, δbk(new).
Given the predicted effect size δbk(new) and assumed known reference group (b) event rate, calculate the event rate in group k and stochastically generate a new set of data, yk(new) from a binomial distribution with fixed sample size, nk(new).
Using the standard hypothesis testing framework, run 1000 simulations whereby each data set generated under a fixed sample size, nk(new) is included in an updated MTC metaanalysis.
The percentage of times the meta-analytic finding is decisive (or “significant”), in the new MTC meta-analysis is the proposed power of the study. Thus, power is calculated by adding the study to the MTC meta-analysis for each simulation iteration, and assessing the proportion of times which the MTC meta-analytic estimate for k:b is decisive (i.e., 95% credible interval excluding 1).
Repeat 1-4 for user-specified fixed sample sizes with range [0,2000].
Results
Mixed Treatment Comparison Model Evaluation
The exact p-values for the test of the null hypothesis of evidence consistency formulated by node splitting comparisons of direct and indirect evidence, as well as node splitting and full model DICs are reported in Table 1. All hypothesis tests of evidence consistency are non-significant at the .05 alpha-level, indicating consistent directionality of evidence and therefore, the appropriateness of MTC meta-analysis for this treatment network. Further, the DICs reported for the full MTC model are consistently lower than those reported from the node-split model, which provides additional evidence of consistency.18
Table 1.
Goodness of fit statistics for Node splitting models. Dbar = posterior mean of the residual deviance, DIC=Deviance Information Criteria, pD=effective degrees of freedom.
|
Treatment Comparison |
Node splitting Posterior mean SD (95% CI) |
Dbar | DIC | pD | MTC Posterior mean SD (95% CI) |
Dbar | DIC | pD |
Inconsistency (p-value) |
|---|---|---|---|---|---|---|---|---|---|
| Relapse: | |||||||||
| NAL:PLB | 0.23(0.01,0.52) | 291.4 | 328.5 | 37.1 | 0.14 | ||||
| ACA:PLB | 0.25(0.01,0.51) | 290.7 | 328.0 | 37.3 | 0.87 | ||||
| NAL+ACA:PLB | 0.25(0.01,0.25) | 291.8 | 329.7 | 37.9 | 0.25(0.02,0.58) | 177.7 | 199.8 | 22.1 | 0.45 |
| ACA:NAL | 0.23(0.01,0.52) | 291.0 | 328.3 | 37.3 | 0.16 | ||||
| NAL:NAL+ACA | 0.26(0.01,0.54) | 291.0 | 329.1 | 38.1 | 0.39 | ||||
| ACA:NAL+ACA | 0.25(0.01,0.54) | 291.7 | 329.5 | 37.8 | 0.64 | ||||
|
Return to
Drinking: |
|||||||||
| NAL:PLB | 0.47(0.28,0.69) | 503.7 | 578.7 | 75.0 | 0.84 | ||||
| ACA:PLB | 0.46(0.27,0.68) | 504.6 | 579.1 | 74.5 | 0.16 | ||||
| NAL+ACA:PLB | 0.49(0.30,0.71) | 503.1 | 578.4 | 75.3 | 0.43(0.21,0.66) | 398.8 | 456.0 | 57.2 | 0.50 |
| ACA:NAL | 0.47(0.29,0.69) | 503.9 | 578.9 | 75.0 | 0.77 | ||||
| NAL:NAL+ACA | 0.49(0.31,0.70) | 503.1 | 578.5 | 75.4 | 0.71 | ||||
| ACA:NAL+ACA | 0.48(0.29,0.70) | 503.7 | 578.6 | 74.9 | 0.30 | ||||
|
% Days
Abstinent:‡ |
|||||||||
| NAL:PLB | 8.59(6.45,9.93) | 341.7 | 394 | 52.1 | 0.49 | ||||
| ACA:PLB | 8.56(6.41,9.93) | 340.7 | 393 | 52.0 | 0.70 | ||||
| NAL+ACA:PLB | 8.49(6.26,9.93) | 342.0 | 394 | 51.8 | 7.29(5.05,9.69) | 246.2 | 290.7 | 44.4 | 0.08 |
| ACA:NAL | 8.60(6.47,9.94) | 341.2 | 393 | 52.0 | 0.34 | ||||
| NANL:NAL+ACA | -- | -- | -- | -- | -- | ||||
| ACA:NAL+ACA | 8.50(6.29,9.93) | 343.4 | 397 | 53.3 | 0.86 | ||||
| Discontinuation: | |||||||||
| NAL:PLB | 0.41(0.27,0.58) | 546.8 | 624.6 | 77.8 | 0.63 | ||||
| ACA:PLB | 0.41(0.26,0.57) | 547.3 | 624.8 | 77.5 | 0.28 | ||||
| NAL+ACA:PLB | 0.41(0.27,0.58) | 546.9 | 624.7 | 77.8 | 0.39(0.24,0.57) | 459.5 | 523.4 | 66.9 | 0.62 |
| ACA:NAL | 0.41(0.27,0.58) | 547.3 | 625.5 | 78.2 | 0.58 | ||||
| NAL:NAL+ACA | 0.42(0.27,0.58) | 546.6 | 624.4 | 77.8 | 0.59 | ||||
| ACA:NAL+ACA | 0.41(0.27,0.58) | 546.9 | 624.5 | 77.6 | 0.29 |
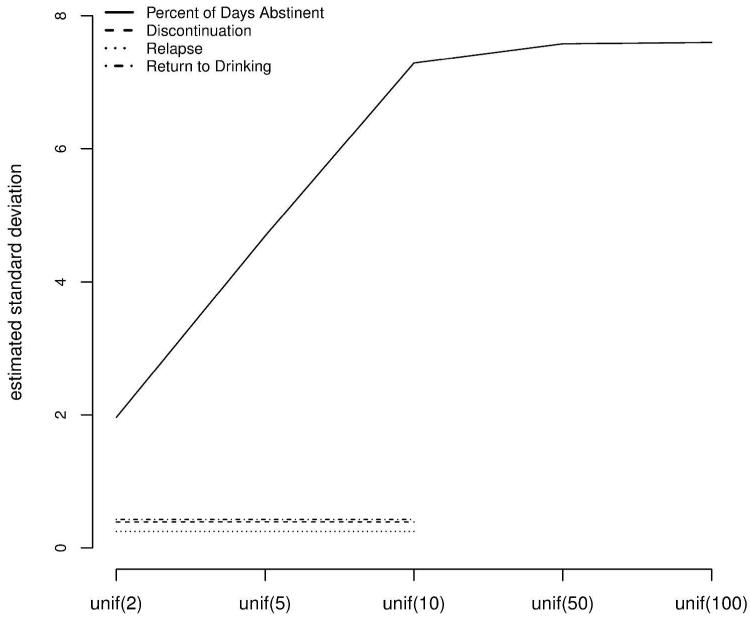
Table 1 also shows that for the binary outcomes, the posterior mean standard deviation is moderate-sized (range = [0.25,0.43]), and different from zero for all three binary outcomes but within an expected range as per previous reports (e.g.,25). For the continuous outcome PDA, the posterior mean SD is also moderate-sized. Global goodness of fit tests including posterior mean of the residual deviance, DIC, and effective degrees of freedom (pD), are also reported in Table 1. Figure 2 shows that the posterior mean estimate of σ for a range of uniform priors remains unchanged for the log odds ratio model, and also remains unchanged for upper bound greater than or equal to 10 for the continuous model. Thus, we use a prior distribution of U(0,10) for the continuous outcome .
Figure 2.
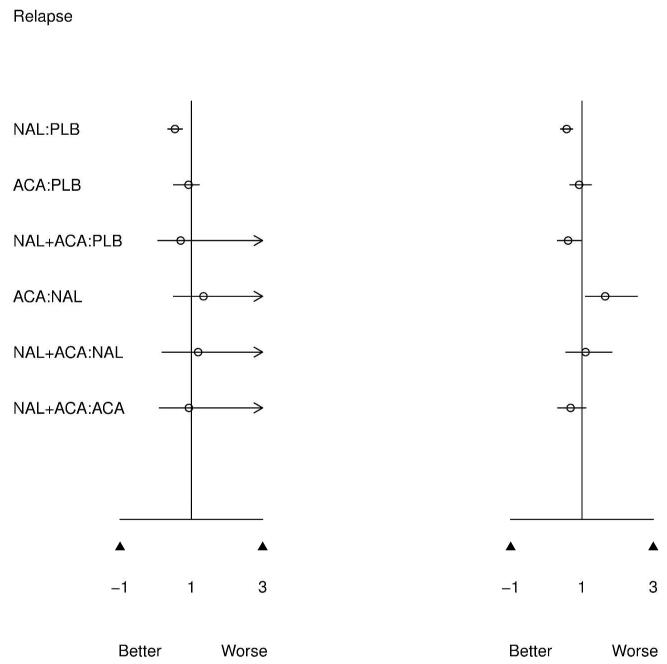
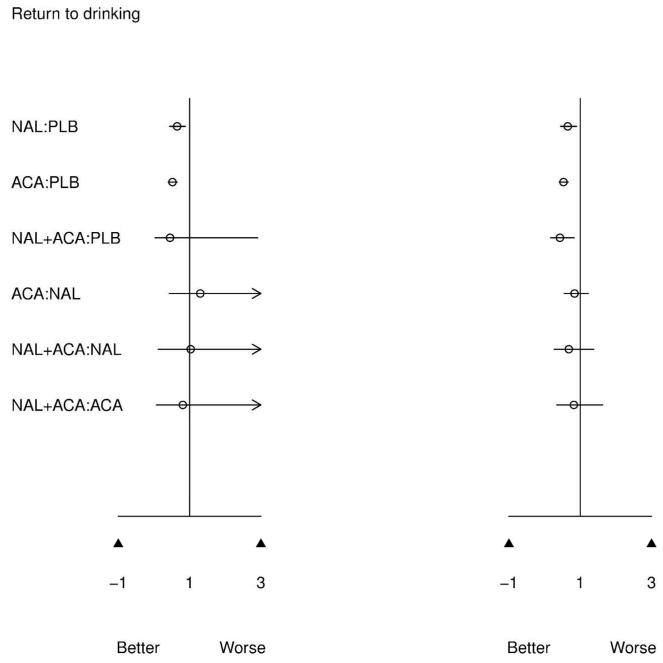
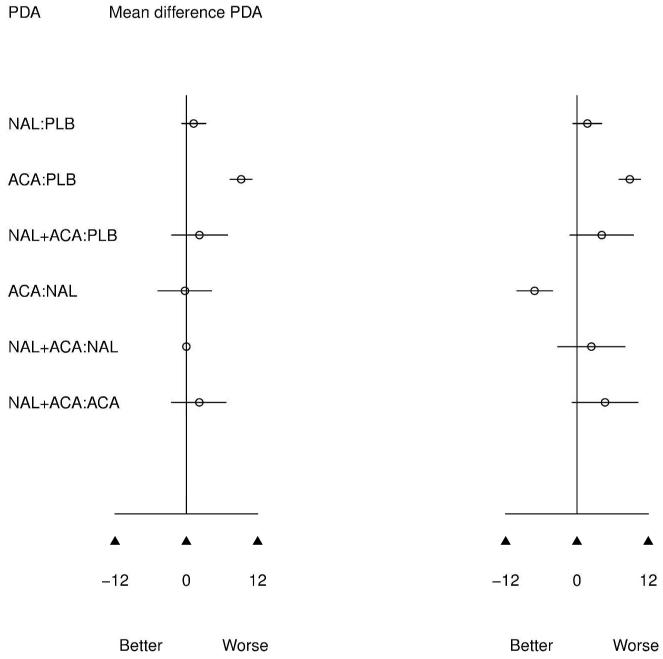
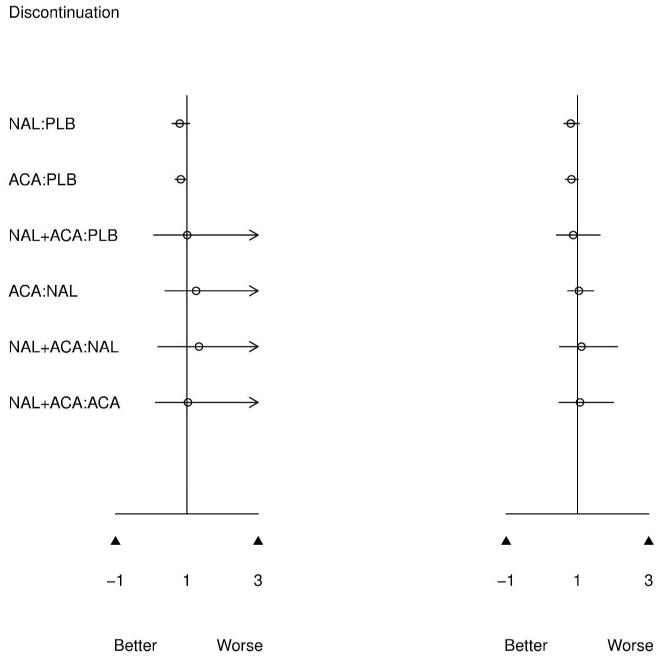
Posterior mean and 95% credible intervals for pairwise (left) and MTC (right) meta-analysis. An OR < 1 and a positive % days abstinent (PDA) both favor the first treatment in the comparisons.
Mixed Treatment Meta-Analysis Results
Figure 3 presents results of the pairwise meta-analysis of head to head trials (left) and MTC meta-analysis (right) for all possible treatment comparisons. MTC and pairwise results are directionally similar, which is expected given confirmed evidence consistency. However, for infrequently compared active treatments, 95% CIs are much narrower for the MTC model. The MTC model clearly benefits from greater precision since common comparator information available from the network of evidence is utilized to improve estimates.
Figure 3.
Posterior mean standard deviation (y-axis) for a sensitivity analysis to prior specification for the standard deviation parameter, σ (x-axis).
Of primary interest is how ACA compares to NAL since only 3 direct comparisons of these treatments have been performed, resulting in not statistically significant pairwise meta-analytic findings. From MTC meta-analysis, ACA increases the odds of relapse versus NAL (OR=1.64 [1.10,2.56]). This effect previously was not found to be significant, although was in the same direction.7,8 Similarly, ACA increases the percent days abstinent over NAL (mean difference=7.14[4.13, 10.11]), which was also not previously detected as significant in pairwise meta-analysis. These findings are consistent with the clinical literature, which posits naltrexone as a treatment for relapse and acamprosate for the maintenance of abstinence.27 Thus, MTC analysis confirms that these treatments appear to have beneficial effects on different aspects of drinking behavior.
Figure 3 also indicates that combined NAL+ACA versus placebo reduces the odds of returning to drinking (OR=0.42[0.16,0.84]). While this is a greater estimated effect size than either NAL or ACA versus placebo, MTC results indicate that combination treatment is not better than either NAL or ACA alone; however, combination treatment has rarely been directly compared with active treatments.
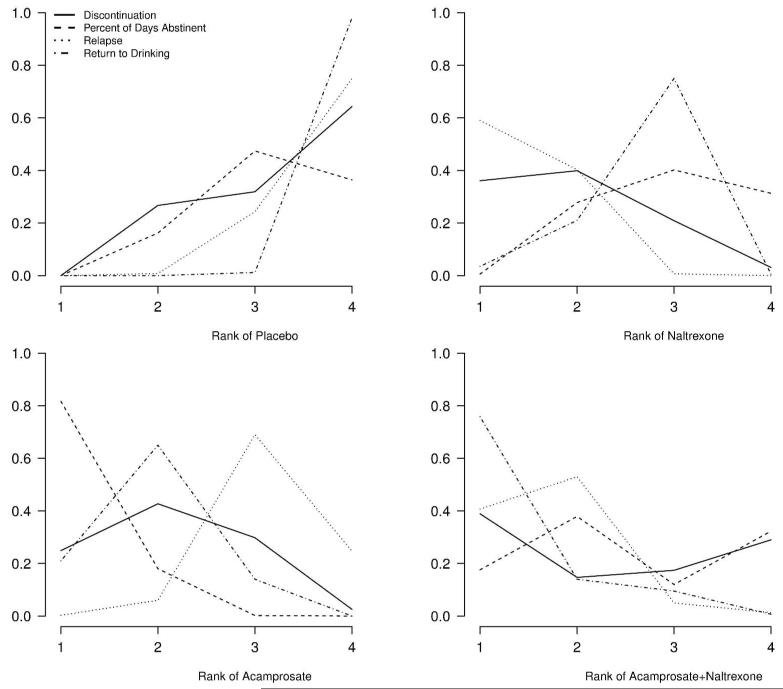
The posterior probabilities of being among the kth best treatments are presented as rankograms in Figure 4.25 The 4 panels show the probability of being the first, second, third, and fourth best treatment for each outcome. While these estimates should not be interpreted conclusively (because they are close in value due to the considerable uncertainty in inference about relative treatment effects, as demonstrated in Figure 3), they are potentially informative for deciding which treatments to further study. It is notable that placebo is never the best treatment. Naltrexone appears to be superior for reducing the odds of relapse (mean probability of being the best = 0.59) while ACA appears to be superior for percent days abstinent (mean probability of being best = 0.82). With respect to discontinuation, all treatment groups appear to be equivalent. We further estimate a weighted rank across the four outcomes using an equal weighting scheme in the absence of prior information as to which outcome is more important (0.25 for each outcome). The posterior probability of being the best treatment is 0, 0.35, 0.24, and 0.41 for PLB, ACA, NAL, and NAL+ACA, respectively. Although MCT meta-analysis is able to provide decisive estimates of treatment effects when pairwise meta-analysis cannot, the posterior rankings for the 3 active treatments are still inconclusive.
Figure 4.
Treatment rankings: probability that each treatment is the kth best (k=1,2,3,4) on reducing relapse, return to drinking, discontinuation, and increasing percent days abstinent.
Planning a New Trial
There is some indication by the weighted (omnibus) posterior rankings, that the treatment combination of NAL+ACA has the highest posterior probability of being the best treatment. This finding is driven by the outcomes RD and relapse. However, decisive effects of the combination treatment versus ACA alone are not detected by MTC meta-analysis (MTC OR = 0.81[0.31,1.58] for RD and 0.69[0.32,1.14] for relapse); however, few head to head trials of combined therapy with any comparator exists. A decisive effect is also not detected in pairwise meta-analysis, a result based on only 2 head to head trials (Figure 1). Specifically, one of these head to head trials did not 27 and one did 28 show a significant effect of combined therapy over ACA monotherapy. Importantly, the trial that did not show significance was 10 times larger than the one that did, thus it provides the majority of the weight in meta-analysis.
Given the equivocal results in light of very little direct evidence for this comparison, subject matter researchers might still question whether there is any benefit of the treatment combination over ACA. In fact, studies are currently underway to detect such effects. 29,30 As a result, we plan a hypothetical new 2-arm trial for RD and relapse powered in the context of an updated MTC meta-analysis to further investigate these interventions. Since most RCTs favor the 2 arm approach, we consider this case for ease of presentation, although the approach easily could be extended to any number of treatment arms. The following serves as an example of how such a study might be planned.
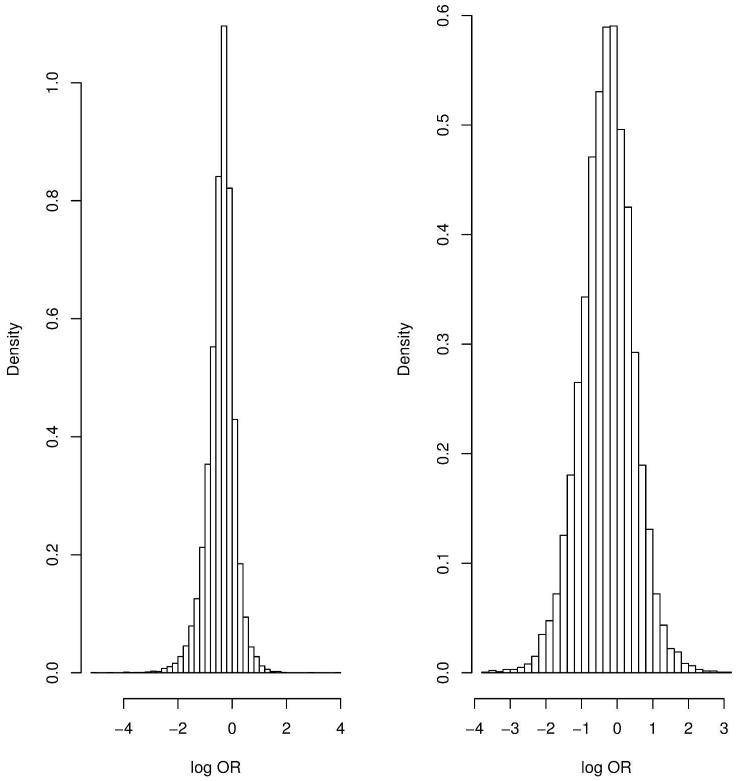
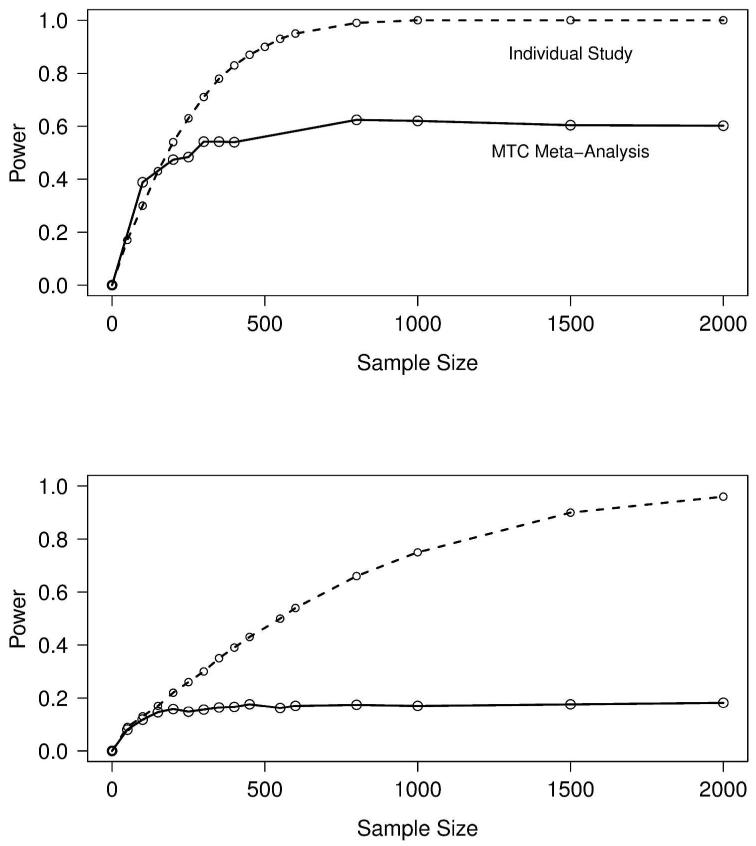
For the outcomes relapse and RD, we obtain predictive estimates for the effect size (log OR), δNAL+ACA:ACA(new), where the event rate of ACA (the reference group) is assumed known from the 24 placebo-controlled trials of acamprosate (Figure 1). The distribution of 1000 sampled predictive effect sizes for the outcomes is shown in Figure 5. Following the methodology outlined in the Methods, Figure 6 shows the power curve for the hypothetical trial designed in two ways: 1.) in isolation, as a single new clinical trial that is not part of the network of evidence, and 2.) in the context of the network of evidence presented in Figure 1, which after the trial’s completion, would be subject to a new MTC meta-analysis. Designing this trial in isolation requires a feasible sample size to obtain 80% power to detect a significant effect on either outcome; however, obtaining 80% power to detect a decisive effect in a new MTC meta-analysis is infeasible, as the power curve asymptotes at approximately 0.60 and 0.18 for relapse and RD, respectively, for any reasonable sample size. The reason for this is that irrespective of the size of the new study, its influence in random effects meta-analysis is limited by the degree of heterogeneity in the analysis. In fact, the sample size directly depends on the amount of heterogeneity in the existing network of trials, as the weight of the ith study in classical random effects meta-analysis is where is the estimated variance of the effect size in the ith (i.e., new) study. 26 In our MTC meta-analysis, the posterior estimate σ2 is moderately large (Table 1), which means the contribution of the new study is proportionally down-weighted. The result is that designing a trial in isolation using the observed random effects meta-analytic effect size will underestimate the size of the trial that needs to be performed to add to the existing network of evidence. This process was repeated by breaking up the new study into several smaller studies. While power improves slightly, 80% power is still not achieved.
Figure 5.
Sampled effect sizes for relapse (left) and return to drinking (right).
Figure 6.
Power and sample size curves for a study of naltrexone+acamprosate versus acamprosate designed in isolation (dashed line) and a study designed to detect significance in a new MTC meta-analysis (solid line) for the outcomes relapse (top) and return to drinking (bottom).
Conclusion
Mixed treatment evidence structures are more common than pairwise structures, 17 and research supports refining evidence synthesis by incorporating both direct and indirect treatment comparisons to better inform health care decisions. 9,16,17,31,32 The role of MTC synthesis is particularly clear in medical decision making where a choice must be made on which of several treatments to adopt in national treatment recommendations, as well as which treatments to further study and how to design those studies. We have shown that consistency of evidence is established for treatments for alcohol dependence, which indicates that a relatively homogenous internal structure exists. We have shown that utilizing MTC evidence allows for the detection of significant effects for treatments that are infrequently directly compared (e.g., ACA vs NAL and NAL+ACA vs Placebo), tighter credible intervals when indirect effects are exploited, and posterior rank ordering of treatments.
The results of our MTC analysis can assist planning and decision-making by determining which treatment comparisons lack direct and/or indirect evidence, and need to be further compared. Specifically, this is achieved by determining effect sizes from a new trial using posterior or posterior predictive estimates from MTC meta-analysis, and then designing the trial in the context of a new MTC meta-analysis. We have presented a methodology for using Bayesian MTC meta-analysis results to determine which treatments should be further studied, for generating predicted clinical trial data, and for powering the new study in the context of refitting the meta-analysis. The simulations show that the power for designing a trial in isolation versus in the context of meta-analysis can be dramatically different, and depends both on the number of direct comparisons and between trial heterogeneity.
Although we did not pursue it in this paper, the value of information (VoI) may also be used for to design and prioritize future trials. 33 This methodology involves evaluating the likelihood that the decision will change following the new study, as well as the net benefit in performing the new study. These quantities of interest depend on source of variation in the current meta-analysis and the predictive heterogeneity. Greater certainty and smaller study bias result in larger value of information. VoI can be evaluated for a range of different types of studies, for example, muti-arm and multi-center, in order to prioritize the RCT to perform next.
Our approach easily could be extended to designing a study for any number of treatment arms, which is a scenario of importance due to the difficulty of such designs. In general, when planning a >2 arm clinical trial, identifying a priori the correlation structure between several treatment effects can be difficult. In the context of a heterogeneous MTC model for multi-arm networks of evidence, the correlation among treatment groups within a study would be propagated through the Bayesian MTC meta-analytic model to the posterior predictive estimates of effect size for a new study; thus, this correlation structure would automatically be taken into account when designing the new study.
Limitations of the current study along with further research directions must be addressed. Firstly, our analysis of several outcomes likely inflates the type I error rate. Rather than enforcing a strict correction for multiple comparisons, this could be addressed in future research via a multivariate MTC meta-analysis, which would help control the type I error rate by exploiting correlation in outcomes, and by borrowing information in light of missing outcomes. Secondly, while naltrexone decreases relapse and acamprosate improves percent days abstinent, which is consistent with their biochemical nature, when taking all 4 outcomes into consideration simultaneously, there is no consensus as to which treatment is best.
Supplementary Material
Acknowledgments
Role of Funding Source
This work was funded by National Institutes of Health National Institute of Alcohol Abuse and Addiction R03 AA020648302.
References
- 1.Chalmers I. The scandalous failure of scientists to cumulate scientifically. abstract to paper presented at: Ninth world congress on health information and libraries. Clinical Trials 2. 2005:229–231. [Google Scholar]
- 2.Mason BJ. Acamprosate and naltrexone treatment for alcohol dependence: An evidence-based risk-benefits assessment. Eur Neuropsychopharmacol. 2003;13(6):469–475. doi: 10.1016/j.euroneuro.2003.08.009. [DOI] [PubMed] [Google Scholar]
- 3.Bouza C, Angeles M, Munoz A, Amate JM. Efficacy and safety of naltrexone and acamprosate in the treatment of alcohol dependence: A systematic review. Addiction. 2004;99(7):811–828. doi: 10.1111/j.1360-0443.2004.00763.x. [DOI] [PubMed] [Google Scholar]
- 4.Snyder JL, Bowers TG. The efficacy of acamprosate and naltrexone in the treatment of alcohol dependence: A relative benefits analysis of randomized controlled trials. Am J Drug Alcohol Abuse. 2008;34(4):449–461. doi: 10.1080/00952990802082198. [DOI] [PubMed] [Google Scholar]
- 5.Mann K, Lehert P, Morgan MY. The efficacy of acamprosate in the maintenance of abstinence in alcohol-dependent individuals: Results of a meta-analysis. Alcohol Clin Exp Res. 2004;28(1):51–63. doi: 10.1097/01.ALC.0000108656.81563.05. [DOI] [PubMed] [Google Scholar]
- 6.Dranitsaris G, Selby P, Negrete JC. Meta-analyses of placebo-controlled trials of acamprosate for the treatment of alcohol dependence: Impact of the combined pharmacotherapies and behavior interventions study. J Addict Med. 2009;3(2):74–82. doi: 10.1097/ADM.0b013e318182d890. [DOI] [PubMed] [Google Scholar]
- 7.Srisurapanont M, Jarusuraisin N. Opioid antagonists for alcohol dependence. Cochrane Database Syst Rev. 2005;(1):CD001867. doi: 10.1002/14651858.CD001867.pub2. [DOI] [PubMed] [Google Scholar]
- 8.Rosner S, Hackl-Herrwerth A, Leucht S, Lehert P, Vecchi S, Soyka M. Acamprosate for alcohol dependence. Cochrane database of systematic reviews (Online) 2010;(9) doi: 10.1002/14651858.CD004332.pub2. [DOI] [PubMed] [Google Scholar]
- 9.Bucher HC, Guyatt GH, Griffith LE, Walter SD. The results of direct and indirect treatment comparisons in meta-analysis of randomized controlled trials. J Clin Epidemiol. 1997;50(6):683–691. doi: 10.1016/s0895-4356(97)00049-8. [DOI] [PubMed] [Google Scholar]
- 10.Eddy DM, Hasselblad V, Shachter R. Meta-analysis by the confidence profile method: The statistical synthesis of evidence. Academic Press; London, UK: 1992. [Google Scholar]
- 11.Hasselblad V. meta-analysis of multitreatment studies. Med Decis Making. 1998;18(1):37–43. doi: 10.1177/0272989X9801800110. [DOI] [PubMed] [Google Scholar]
- 12.Lumley T. Network meta-analysis for indirect treatment comparisons. Stat Med. 2002;21(16):2313–2324. doi: 10.1002/sim.1201. [DOI] [PubMed] [Google Scholar]
- 13.Nixon RM, Bansback N, Brennan A. Using mixed treatment comparisons and meta-regression to perform indirect comparisons to estimate the efficacy of biologic treatments in rheumatoid arthritis. Stat Med. 2007;26(6):1237–1254. doi: 10.1002/sim.2624. [DOI] [PubMed] [Google Scholar]
- 14.Salanti G, Dias S, Welton NJ, et al. Evaluating novel agent effects in multiple-treatments meta-regression. Stat Med. 2010;29(23):2369–2383. doi: 10.1002/sim.4001. [DOI] [PubMed] [Google Scholar]
- 15.Salanti G, Ades AE, Ioannidis JP. Graphical methods and numerical summaries for presenting results from multiple-treatment meta-analysis: An overview and tutorial. J Clin Epidemiol. 2011;64(2):163–171. doi: 10.1016/j.jclinepi.2010.03.016. [DOI] [PubMed] [Google Scholar]
- 16.Lu G, Ades AE. Combination of direct and indirect evidence in mixed treatment comparisons. Stat Med. 2004;23(20):3105–3124. doi: 10.1002/sim.1875. [DOI] [PubMed] [Google Scholar]
- 17.Lu G, Ades A. Assessing evidence inconsistency in mixed treatment comparisons. J Am Stat Assoc. 2006;101(474):447–459. [Google Scholar]
- 18.Dias S, Welton NJ, Caldwell DM, Ades AE. Checking consistency in mixed treatment comparison meta-analysis. Stat Med. 2010;29(738):932–944. doi: 10.1002/sim.3767. [DOI] [PubMed] [Google Scholar]
- 19.Hong H, Carlin BP, Shamliyan TA, et al. Comparing bayesian and frequentist approaches for multiple outcome mixed treatment comparisons. Med Decis Making. 2013 doi: 10.1177/0272989X13481110. [DOI] [PubMed] [Google Scholar]
- 20.Lunn DJ, Thomas A, Best N, Spiegelhalter D. WinBUGS 3 a Bayesian modelling framework: concepts, structure, and extensibility. Statistics and Computing. 2000;10:325–337. [Google Scholar]
- 21.Dias S, Welton N, Sutton A, Ades A. [Accessed October 25, 2012];NICE DSU technical support document 2: A generalised linear modelling framework for pairwise and network meta-analysis of randomised controlled trials. 2013 Mar; http://www.nicedsu.org.uk/Evidence-Synthesis-TSD-series(2391675).htm. Updated. [PubMed]
- 22.Dias S, Sutton AJ, Ades AE, Welton NJ. Evidence synthesis for decision making 2: A generalized linear modeling framework for pairwise and network meta-analysis of randomized controlled trials. Med Decis Making. 2013;33(5):607–617. doi: 10.1177/0272989X12458724. [DOI] [PMC free article] [PubMed] [Google Scholar]
- 23.Dias S, Welton NJ, Sutton AJ, Ades AE. Evidence synthesis for decision making 1: Introduction. Med Decis Making. 2013;33(5):597–606. doi: 10.1177/0272989X13487604. [DOI] [PMC free article] [PubMed] [Google Scholar]
- 24.Spiegelhalter DJ, Best NG, Carlin BP, Van Der Linde A. Bayesian measures of model complexity and fit. Journal of the Royal Statistical Society. 2002;(64):583. Series B (Statistical Methodology) [Google Scholar]
- 25.Ades AE, Mavranezouli I, Dias S, Welton NJ, Whittington C, Kendall T. Network meta-analysis with competing risk outcomes. Value Health. 2010;13(8):976–983. doi: 10.1111/j.1524-4733.2010.00784.x. [DOI] [PubMed] [Google Scholar]
- 26.Sutton AJ, Cooper NJ, Jones DR, Lambert PC, Thompson JR, Abrams KR. Evidence-based sample size calculations based upon updated meta-analysis. Stat Med. 2007;26(12):2479–2500. doi: 10.1002/sim.2704. [DOI] [PubMed] [Google Scholar]
- 27.Anton RF, O’Malley SS, Ciraulo DA, et al. Combined pharmacotherapies and behavioral interventions for alcohol dependence: The COMBINE study: A randomized controlled trial. JAMA. 2006;295(17):2003–2017. doi: 10.1001/jama.295.17.2003. [DOI] [PubMed] [Google Scholar]
- 28.Kiefer F, Jahn H, Tarnaske T, et al. Comparing and combining naltrexone and acamprosate in relapse prevention of alcoholism: A double-blind, placebo-controlled study. Arch Gen Psychiatry. 2003;60(1):92–99. doi: 10.1001/archpsyc.60.1.92. [DOI] [PubMed] [Google Scholar]
- 29.Mann K, Kiefer F, Smolka M, et al. Searching for responders to acamprosate and naltrexone in alcoholism treatment: Rationale and design of the PREDICT study. Alcohol Clin Exp Res. 2009;33(4):674–683. doi: 10.1111/j.1530-0277.2008.00884.x. [DOI] [PubMed] [Google Scholar]
- 30.Mann K, Hermann D. Individualised treatment in alcohol-dependent patients. Eur Arch Psychiatry Clin Neurosci. 2010;260(Suppl 2):S116–20. doi: 10.1007/s00406-010-0153-7. [DOI] [PubMed] [Google Scholar]
- 31.Caldwell D, Ades A, Higgins J. Simultaneous comparison of multiple treatments: Combining direct and indirect evidence. BMJ. 2005 Oct 15;331(7521):897–900. doi: 10.1136/bmj.331.7521.897. [DOI] [PMC free article] [PubMed] [Google Scholar]
- 32.Phillips B, Ball C, Sackett D, et al. Oxford centre for evidence-based medicine levels of evidence. 2001 http://www.cebm.net/levelsofevidence.asp. Updated.
- 33.Soares MO, Welton NJ, Harrison DA, et al. An evaluation of the feasibility, cost and value of information of a multicentre randomised controlled trial of intravenous immunoglobulin for sepsis (severe sepsis and septic shock): Incorporating a systematic review, meta-analysis and value of information analysis. Health Technol Assess. 2012;16(7):1–186. doi: 10.3310/hta16070. [DOI] [PMC free article] [PubMed] [Google Scholar]
Associated Data
This section collects any data citations, data availability statements, or supplementary materials included in this article.


