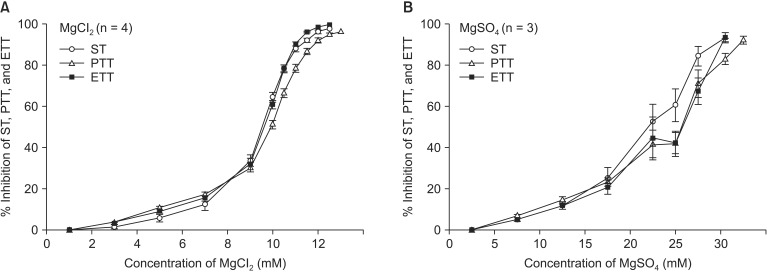
Fig. 2.
The cumulative concentration-response (C-R) curves of MgCl2 (A) and MgSO4 (B) on the single twitch (ST) at 0.1 Hz and peak tetanic tension (PTT) and end tetanic tension (ETT) at 50 Hz for 1.9 seconds. The decline trends of ST, PTT, and ETT are similar to each other. PTT remains after disappearance of ST and ETT at the highest concentrations of two chemicals. Data are presented as mean ± SEM. n is the number of experiments.

