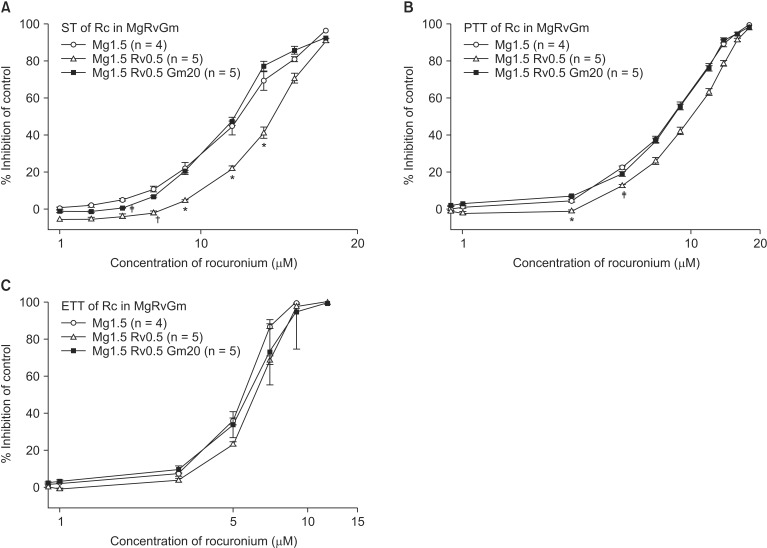
Fig. 8.
Based on the cumulative concentration-response (C-R) curves of rocuronium on ST (A), PTT (B) and ETT (C), pretreated 0.5 µM ropivacaine added to 1.5 mM MgCl2 shifts the C-R curves of rocuronium to the right; hence it antagonizes the effect of rocuronium in 1.5 mM MgCl2. The concentration of rocuronium is transformed to log concentration. Data are presented as mean ± SEM. The units of concentrations for Mg, Rv, and Gm are mM, µM, µM, respectively. n is the number of experiments. Gm: gentamicin, Mg: magnesium chloride, Rc: rocuronium, Rv: ropivacaine, ST: single twitch, PTT: peak tetanic tension, ETT: end tetanic tension. *P < 0.05, vs. Mg 1.5 mM + Rv 0.5 µM + Gm 20 µM, †P < 0.05, vs. Mg 1.5 mM + Rv 0.5 µM + Gm 20 µM and Mg 1.5 mM, and ‡P < 0.05, vs. Mg 1.5 mM by t-test with Bonferroni's correction.

