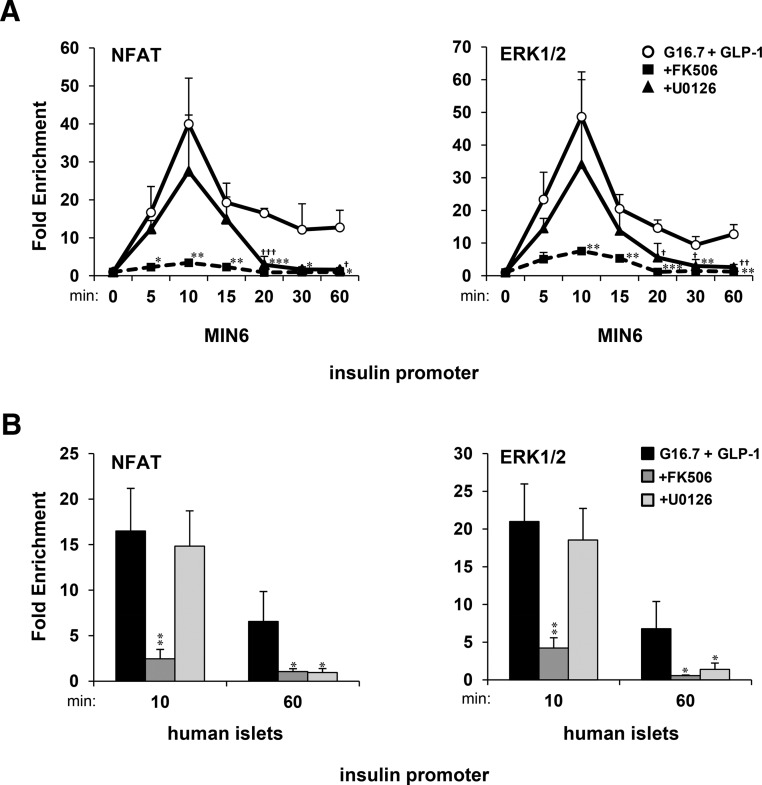
Figure 3.
Sustained association of NFAT and ERK with the insulin gene promoter requires CN and ERK1/2 activity. ChIP-qPCR time-course analysis of fold enrichment of NFATc2 and ERK1/2 upon the insulin gene promoter in (A) MIN6 cells and (B) human islets in response to 16.7mM glucose and 20nM GLP-1 in the presence of FK506 and U0126 with respect to 2.8mM glucose (control). Graphed results are expressed as mean ± SD determined from at least 3 independent experiments. Asterisks above bars or next to plots indicate statistically significant differences (* and †, P < .05; ** and ††, P < .01; *** and †††, P < .001) in mean values for treatments compared with the stimulatory group (16.7mM glucose and 20nM GLP-1) at corresponding time points based on a one-way ANOVA and Dunnett's multiple comparison post hoc test.

