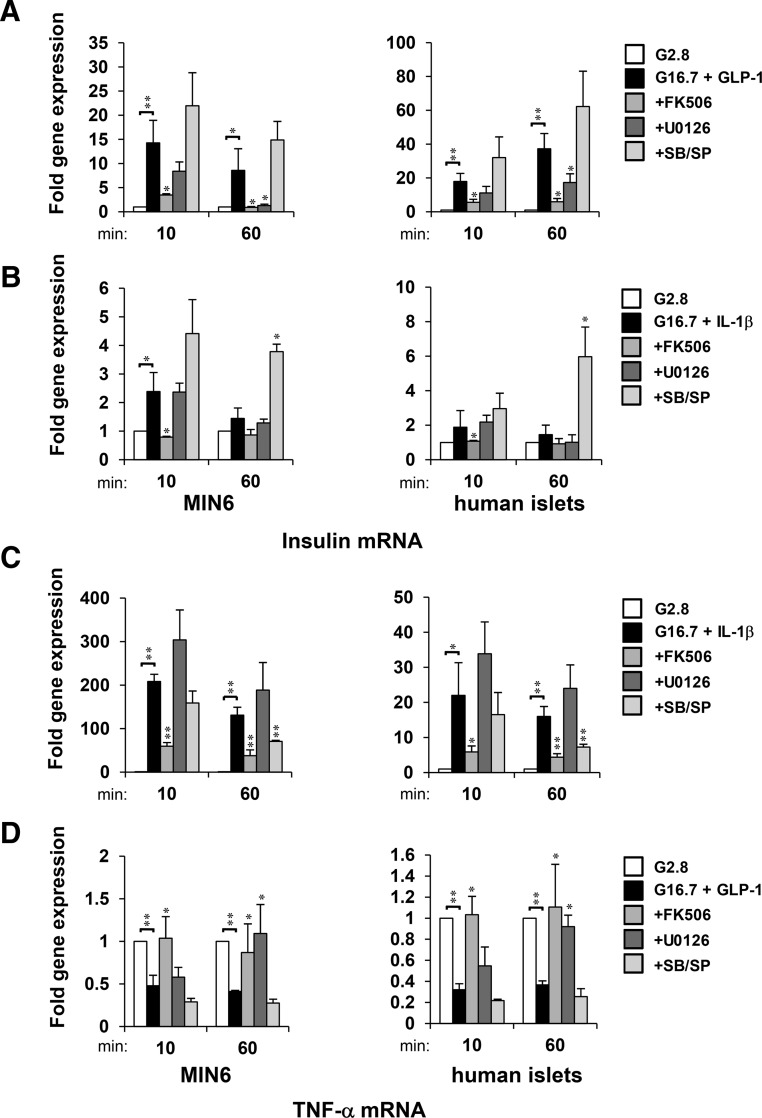
Figure 7.
Acute and sustained activation and repression of insulin and TNF-α mRNA expression is differentially regulated by MAPK activity. Nuclear run-on analysis of fold induction of insulin (A and B) and TNF-α (C and D) gene transcripts synthesized from nuclei isolated from MIN6 cells and human islets upon 10 and 60 minutes of treatment with IL-1β or GLP-1 as relative to 2.8mM glucose controls. Graphed results are expressed as mean ± SD determined from at least 3 independent experiments. Asterisks next to plots indicate statistically significant differences (*, P < .05; **, P < .01) in mean values for treatments compared with stimulatory groups (16.7mM glucose and 20nM GLP-1 or 20-ng/mL IL-1β) at t = 10- and 60-minute time points based on a one-way ANOVA and Dunnett's multiple comparison post hoc test.

