Figure 4.
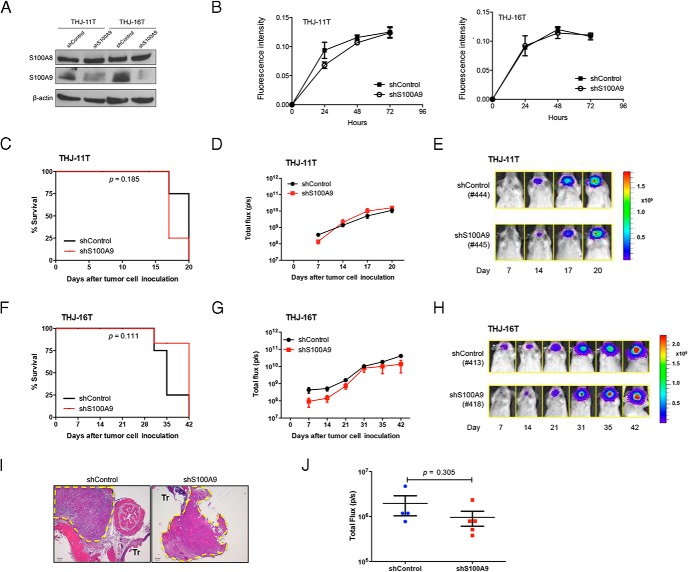
RNAi-mediated S100A9 knockdown does not prolong survival. A, Western blot analysis of S100A8 and S100A9 protein levels in THJ-11T or THJ-16T cells expressing control shRNA or S100A9 shRNA. β-actin was used as loading control. B, Growth curve of THJ-11T and THJ-16T cells expressing control shRNA or S100A9 shRNA as determined by Alamar blue assay. Each point represents the mean ± S.E.M. Similar results were obtained in two independent experiments. C, Survival curve of mice injected with THJ-11T expressing control shRNA or S100A9 shRNA. n = 4 mice per group. D, Bioluminescent signals were quantified as total flux (p/s) and plotted against the days since implantation. Mice injected with THJ-11T cells in which S100A9 expression was silenced displayed a similar time to tumor onset and progression as control mice. E, Representative bioluminescent images of mice injected with THJ-11T expressing control shRNA or S100A9 shRNA. All mice were reimaged using the same setting of the IVIS. F, Survival curve of mice injected with THJ-16T expressing control shRNA or S100A9 shRNA. n = 4 mice per group. G, Bioluminescent signals were quantified as total flux (p/s) and plotted against the days since implantation. Note that mice injected with THJ-16T cells in which S100A9 expression was silenced displayed a similar time to tumor onset and progression as control mice. H, Representative bioluminescent images of mice injected with THJ-16T expressing control shRNA or S100A9 shRNA. I, Representative histology images of thyroid tumors at day 20 of mice injected with THJ-11T expressing control shRNA or S100A9 shRNA. Broken yellow lines indicate tumors. Tr, trachea. Scale bar, 100 μm. J, Bioluminescent signals of lung metastasis were quantified as total flux (p/s) and plotted at 4 weeks after tail vein injection of THJ-11T expressing control shRNA or S100A9 shRNA.

