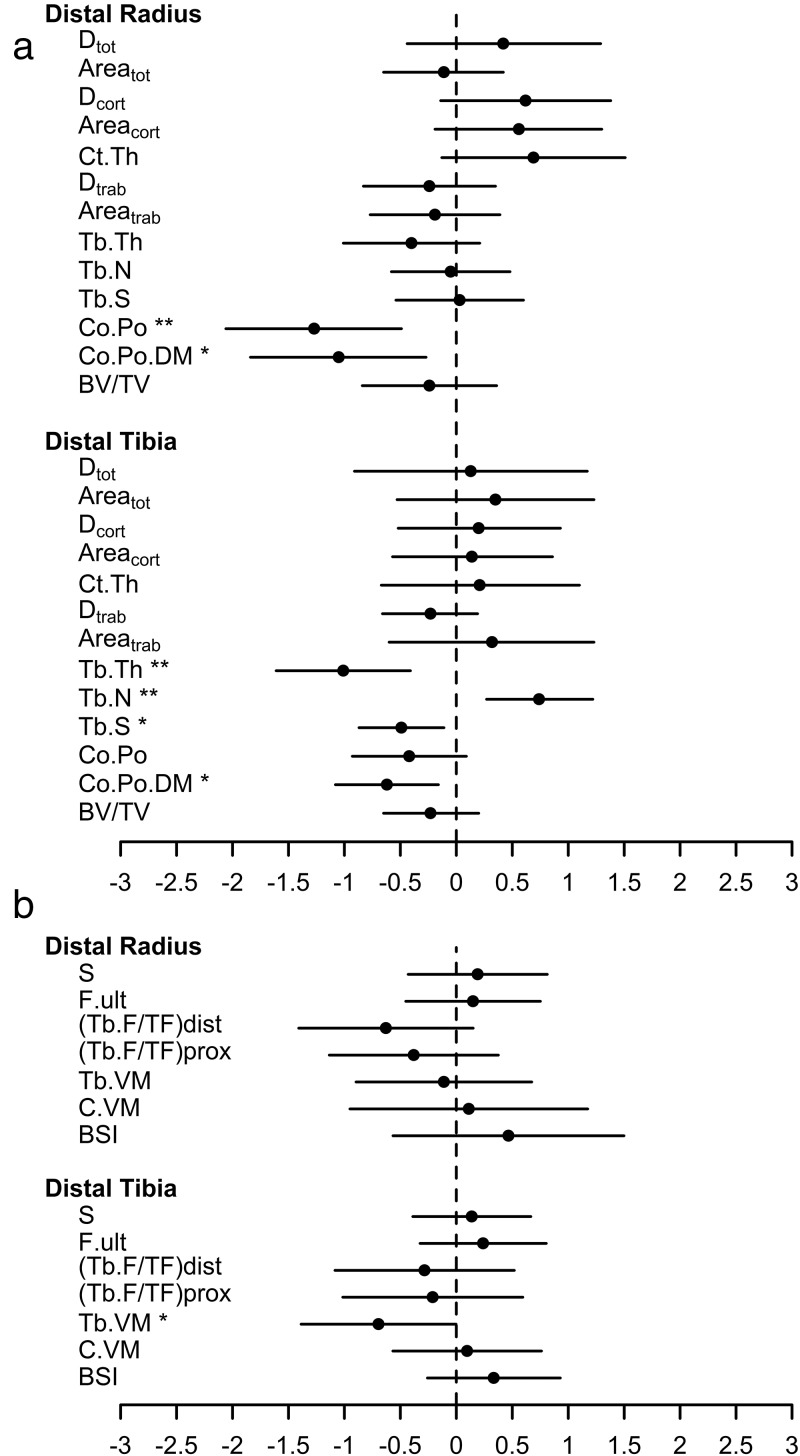
Figure 1.
(a) and (b): Difference in mean and standard deviation score for (a) cortical and trabecular bone microstructure parameters (b) for HR-pQCT derived microFE bone strength, for lean and obese groups. Values are standardized using the mean and SD from the lean group. Circles represent the mean and lines represent the 95% confidence intervals

