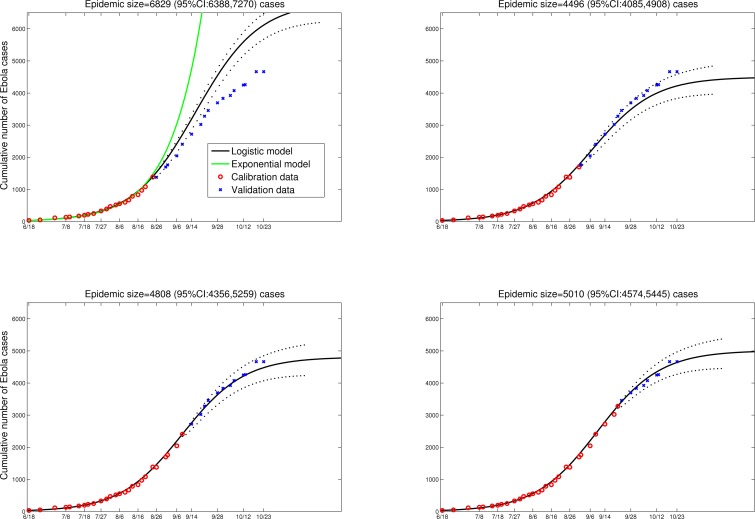
Liberia.
Predictions of the cumulative number of Ebola cases in Liberia by the logistic growth equation C’(t) = rC(1-C/K) where C’(t) is the rate of change in the cumulative number of total Ebola cases comprising suspected, probable and confirmed cases, “r” is the intrinsic growth rate (1/day) and K is the final epidemic size. The total number of Ebola cases satisfies essentially a density dependent exponential equation, with an exponent linearly decreasing as a function of the total cases reported. The two parameters “r” and “K” were estimated from the early epidemic phase by numerical optimization. Model fits (A-D) are shown for an increasing number of data points used for model calibration. The black solid lines correspond to C(t), the predicted cumulative number of Ebola cases. Blue circles are future cases used for model validation. The exponential model fit (green solid line) is shown as a reference for a worst-case scenario in panel A. We model here the national epidemic curve for Liberia, which follows a similar epidemic pattern to that of Montserrado county, the subset analyzed by Lewnard et al. The dotted lines correspond to the 95% confidence intervals of the prediction curve provided by the model.

