Guinea.
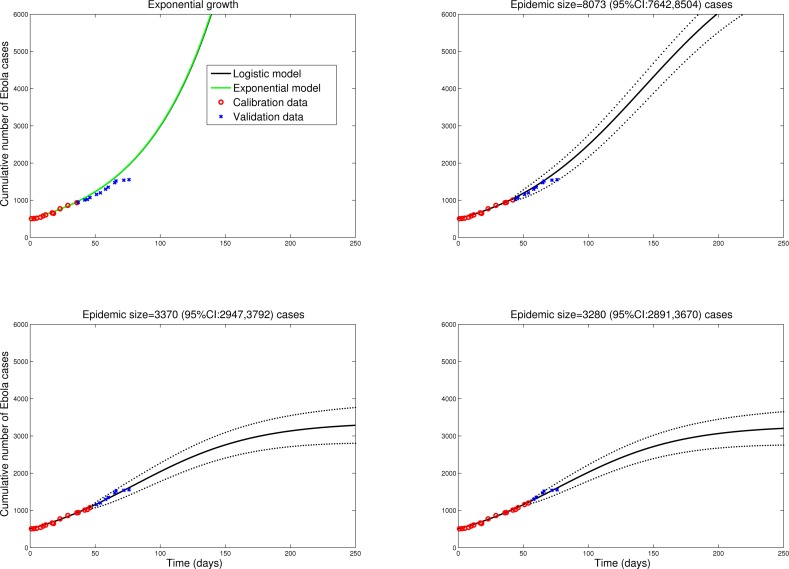
Predictions of the cumulative number of Ebola cases in Guinea by the logistic growth equation (see Figure 1 or text for equation). Model fits (A-D) are shown for an increasing number of data points used for model calibration. The black solid lines correspond to C(t), the predicted cumulative number of Ebola cases. Blue circles are future cases used for model validation. We model here the second phase of the national epidemic curve for Guinea (Guinea has a biphasic epidemic due to spatial heterogeneity in EBOV transmission).

