Figure 2.

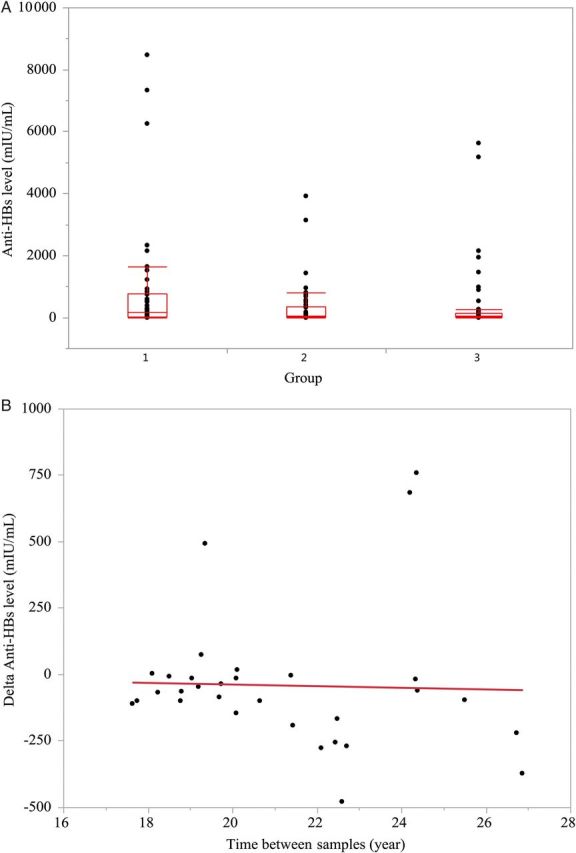
A, Box plots showing distribution of antibody to hepatitis B surface antigen (anti-HBs) levels among subjects in the 3 groups. There was no difference in anti-HBs levels among the 3 groups: group 1 (10–15 years since vaccination), 811 mIU/mL; group 2 (16–20 years since vaccination), 321 mIU/mL; and group 3 (>20 years since vaccination), 371 mIU/mL (P = .1). Average, 25th and 75th percentiles, and range are shown. B, Change in anti-HBs levels over time since initial vaccination. There was no correlation between the magnitude of change in anti-HBs level over time (r2 = 0.0013, P = .85). Change was calculated based on last anti-HBs level minus initial anti-HBs level usually obtained 9–12 months after first vaccine dose (n = 36).
