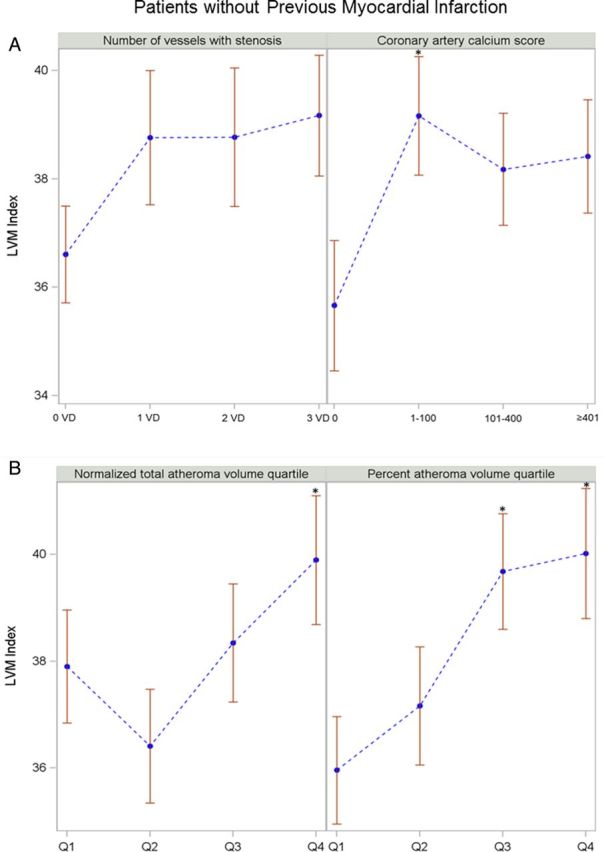
Figure 4:

The relationship of LVMi with CTA parameters among patients without previous MI. *P < 0.05. Error bars represent standard error. Comparisons by ANOVA. For CTA parameters and atheroma volume indices, vs. no diseased vessel, zero calcium score, and first quartile group as a reference. LVMi (A) across CTA parameters: number of vessel disease and categorized coronary calcium score. LVMi (B) across atheroma volume indices: NormTAV and PAV.
