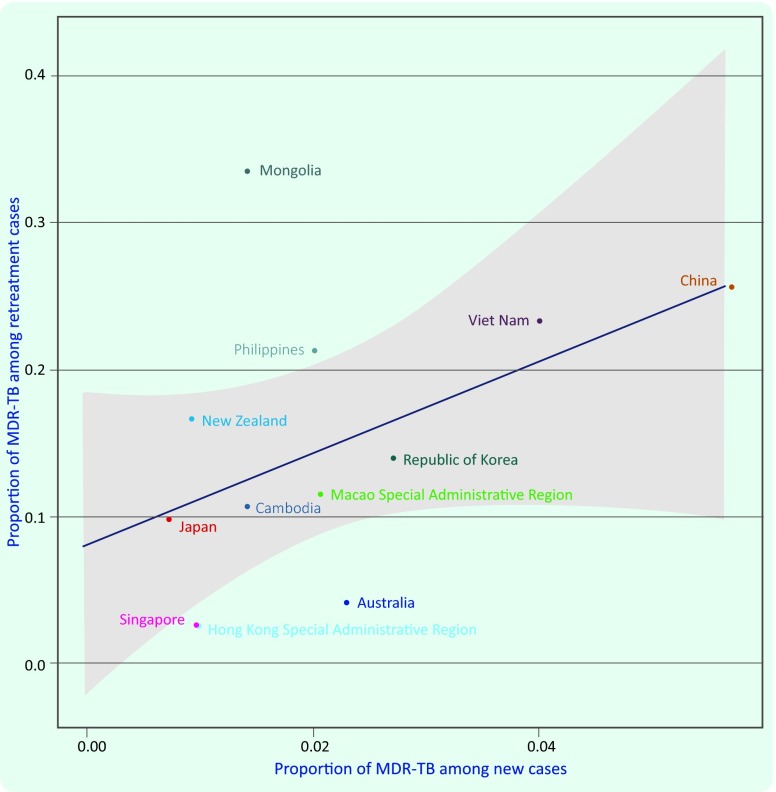
Figure 2.
Correlation* between the estimated proportion of MDR-TB cases among new and previously treated TB cases respectively by selected country,† WHO Western Pacific Region, 2013
MDR-TB, multidrug-resistant tuberculosis.
* Line represents the linear regression and the grey band represents 95% CI.
† Countries that reported their own MDR-TB estimates for new and previously treated cases in 2013.

