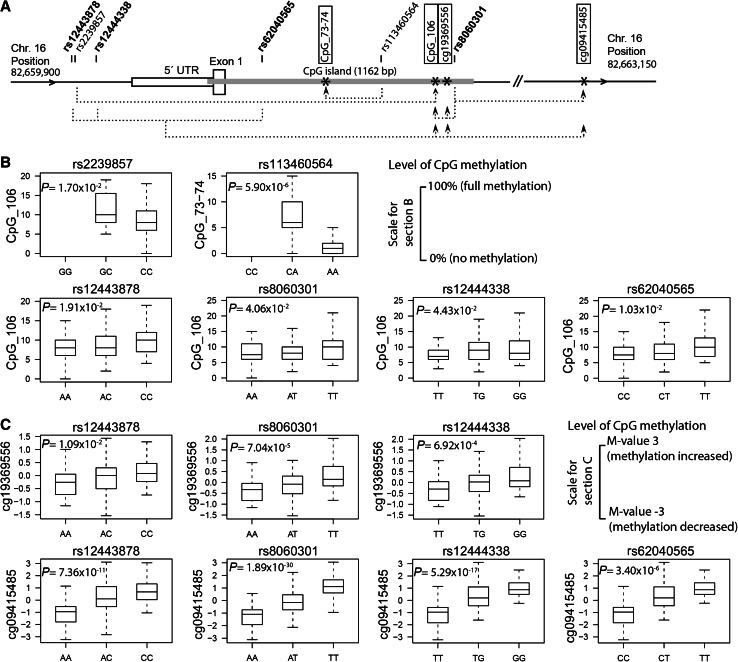
Fig. 2.
Identified CDH13 promoter meQTLs modulating methylation levels in neighboring CpG sites. a Dotted lines connect meQTLs and CpG sites (boxed) showing significantly modulated methylation (*) in HYPEST–CADCZ (CpG_106, CpG_73–74) and EGCUT (cg19369556, cg09415485). Common SNPs are marked in bold. b Genotype effects of identified mQTLs on DNA methylation at selected CpG sites in HYPEST–CADCZ meta-analysis. Y-axis depicts measured DNA methylation level (%; 0 % no methylation, 100 % full methylation). P value was calculated using linear regression, including age, gender and experiment series as covariates in the model. c Genotype effects of tested mQTLs on DNA methylation variation in the EGCUT dataset. Y-axis represents relative DNA methylation level on transformed scale (M value). FDR-corrected P values were calculated using linear regression

