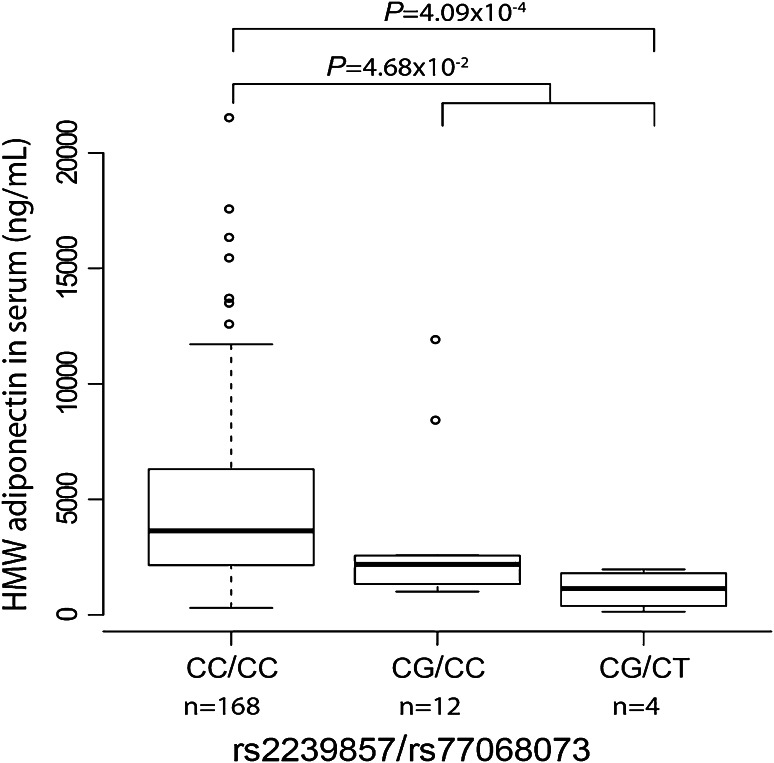
Fig. 3.
Novel genetic variants rs2239857 and rs77068073 associated with adiponectin level in blood serum. HMW adiponectin levels are shown for analyzed HYPEST subjects stratified based on their genotypes: heterozygotes for rs2239857 minor allele (n = 12, CG/CC), ‘double’ heterozygotes for both, rs2239857 and rs77068073 (n = 4, CG/CT) and homozygotes for major alleles of both SNPs (n = 168, CC/CC). The boxes represent the 25th and 75th percentiles. The median is denoted as the line that bisects the boxes. The whiskers are lines extending from each end of the box covering the extent of the data on 1.5× interquartile range. Circles represent the outlier values. P values from the t test comparing adiponectin levels of CC/CC group with CG/CT group and combined group of CG/CC and CG/CT are shown

