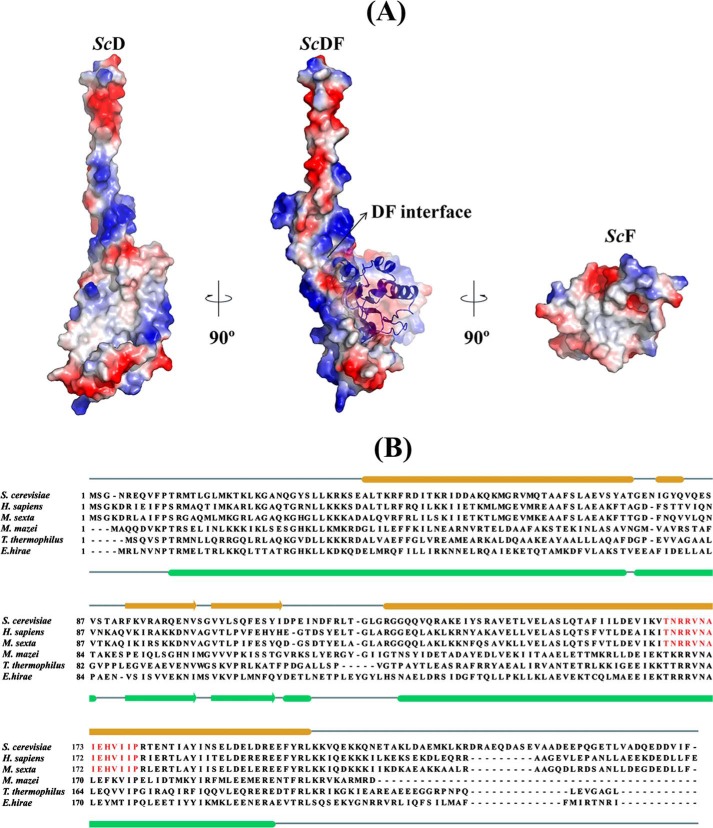
FIGURE 3.
Surface electrostatic and hydrophobicity of DF assembly and sequence comparison of subunit D. A, surface electrostatic potential of the ScDF complex with ScF shown as schematic and the DF interface labeled by an arrow is shown in the center. Surface electrostatic potential of ScD reveals that the interacting surface with ScF is mostly hydrophobic, whereas the exposed N and C termini of ScD are composed of basic and predominantly acidic residues (left). The interacting surface of ScF is predominantly hydrophobic (right). The electrostatic potential surfaces were calculated using APBS (56) and mapped at contouring levels from −3 kT (blue) to 3 kT (red). B, sequence alignment of subunit D from different V-ATPases and ATP synthases, respectively. The secondary structure elements of subunit D of the E. hirae A-ATP synthase and the S. cerevisiae V-ATPase are shown. The conserved sequence in the eukaryotic V-ATPases is highlighted in red.

