FIGURE 5.
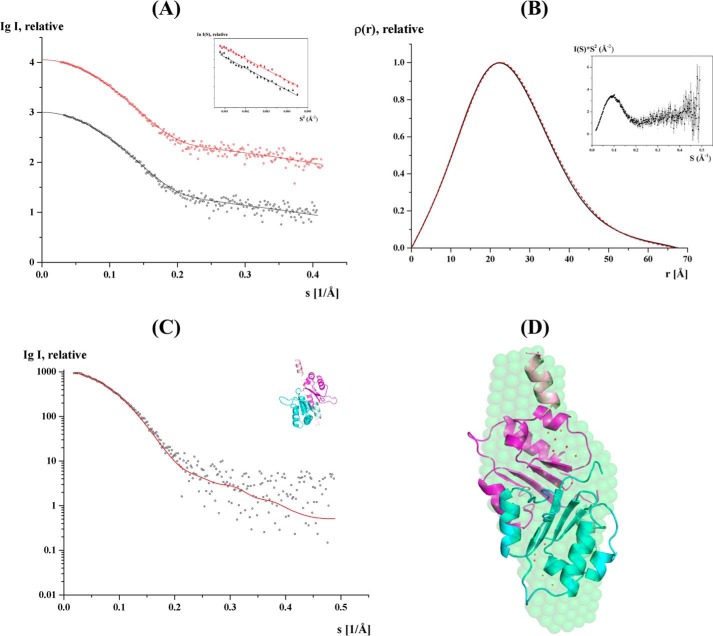
Solution x-ray scattering studies of ScF. A, small angle x-ray scattering pattern (○) and its corresponding experimental fitting curves (- - -) for the concentrations 2.0 (black) and 4.2 (red) mg/ml. The scattering curves of ScF are displayed in logarithmic units for clarity. Inset, Guinier plots show linearity for the concentrations used, indicating no aggregation. B, pair-distance distribution function P(r) of ScF at 2.0 (black) and 4.2 (red) mg/ml. Inset, Kratky plot of ScF SAXS data at 4.2 mg/ml. C, fit of the scattering profile of the CORAL model with the best χ value of 1.24 (red) to the experimental scattering pattern of ScF at 2 mg/ml (black). D, CORAL model generated is superimposed with the solution shape of ScF. The compact monomer of the dimer is colored cyan, and the extended monomer is colored magenta. The C-terminal helices are colored lighter and the flexible regions are represented as dots and colored red.

