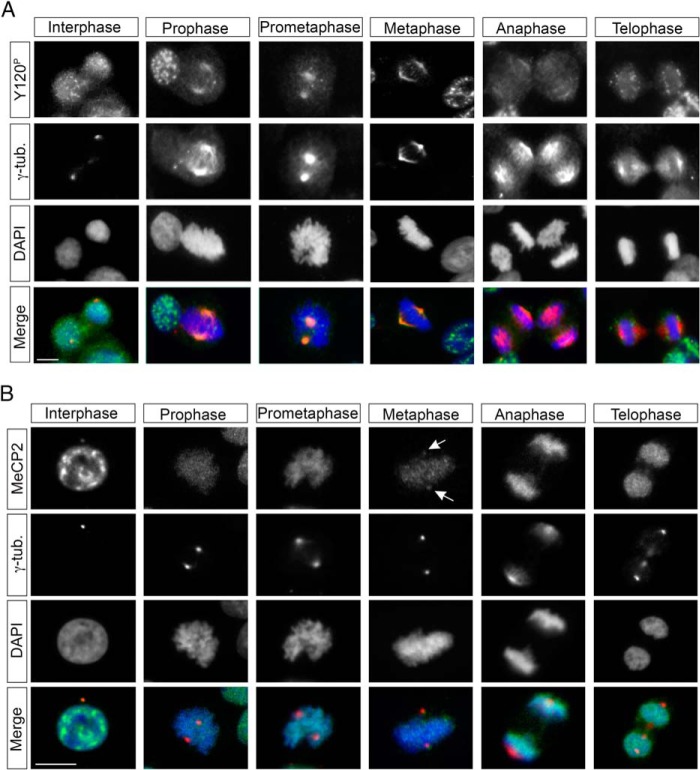
FIGURE 2.
Localization of MeCP2 during the cell cycle. A and B, HeLa cells were grown on coverslips, fixed, and costained with antibodies against MeCP2 Tyr(P)-120 or total MeCP2 (A and B, respectively, both in green) and γ-tubulin (γ-tub, red) and with DAPI (blue) to visualize DNA. Arrows indicate centrosomal MeCP2 in metaphase cells (n > 3). Scale bars = 10 μm.

