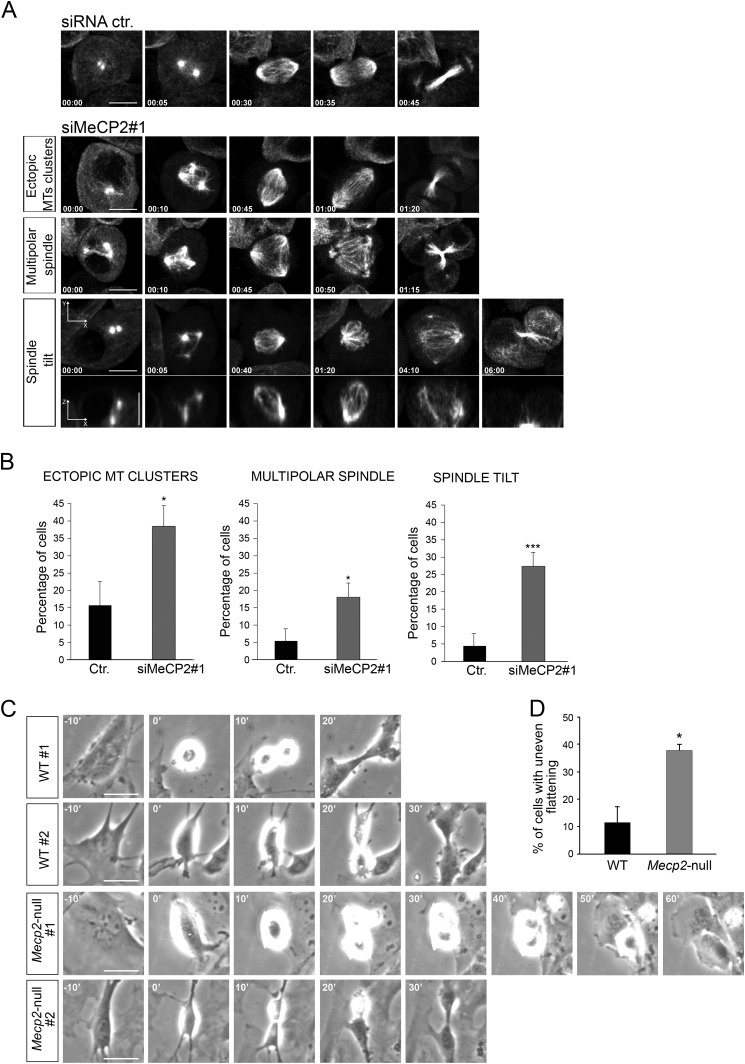
FIGURE 8.
In the absence of MeCP2, several spindle aberrations are observed. A, selected frames of different classes of mitotic defects that were analyzed from live-cell time-lapse microscopy of HeLa cells stably expressing α-tubulin-GFP 80 h after treatments with control (Ctr.) or siMeCP2#1. Time is shown in minutes:seconds. Defects include ectopic MT clusters, multipolar spindle, and spindle tilt (spindle poles in different focal planes), as shown in representative x-y (maximum projection) and x-z (single plane) confocal images (bottom panel) (n = 3). Scale bar = 10 μm. B, manual quantification of mitotic defects from movies of α-tubulin-GFP-expressing HeLa cells transfected with control (n = 75) or MeCP2 (n = 234) siRNA. Means and S.E. are shown. *, p < 0.05; ***, p < 0.001; unpaired Student's t test). C, time-lapse images show uneven timing of daughter cell flattening onto the substrate after mitosis (misoriented cell division) in Mecp2-null MEFs compared with the wild type. Images represent MEFs from two different WT and null embryos, respectively. Time is shown in minutes. Scale bars = 10 μm, n = 2. D, manual quantification of mitotic defects from movies of WT (n = 50) and Mecp2-null MEFs (n = 60). Means ± S.E. are shown. *, p < 0.05; unpaired Student's t test).

