
FIGURE 3.
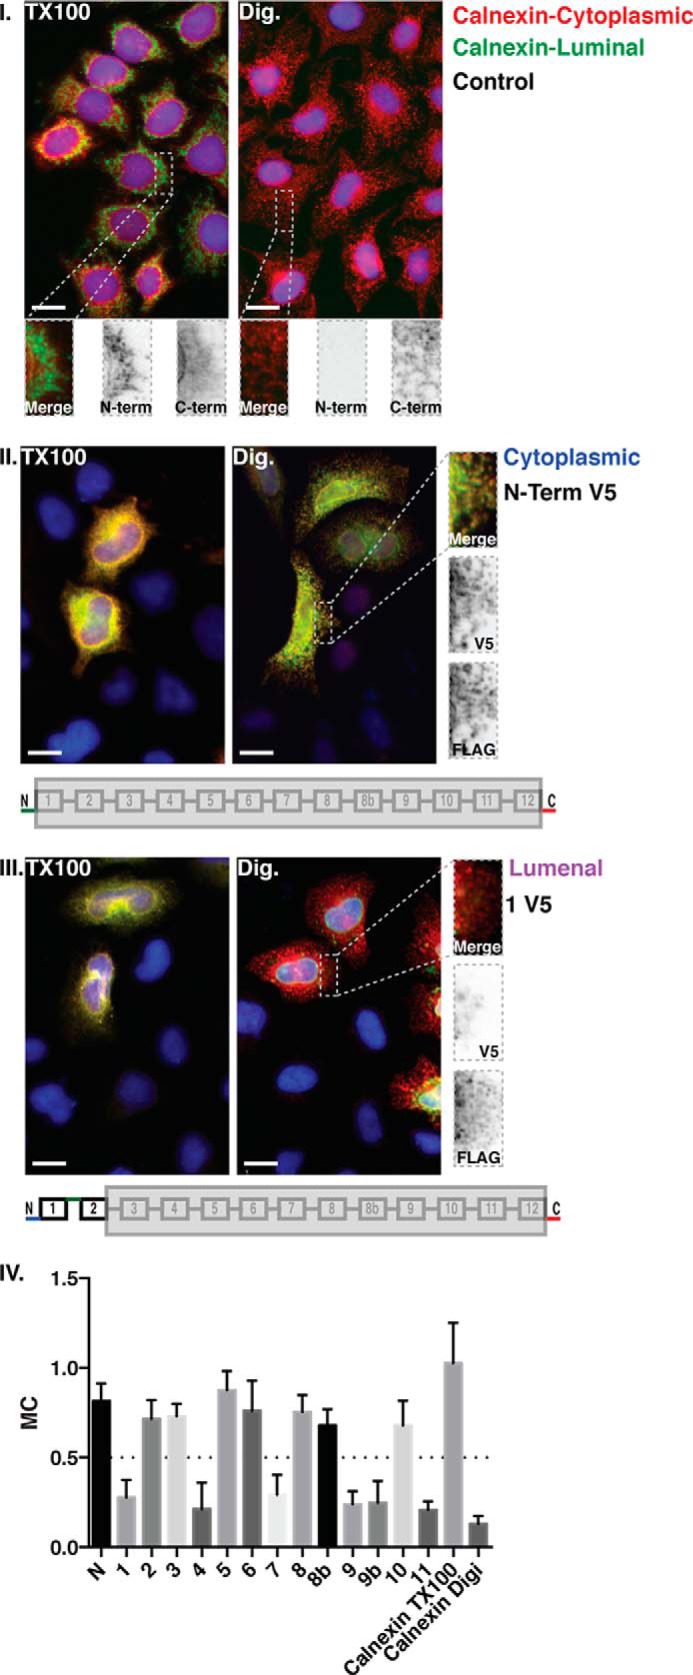
Mapping of HHAT topology by V5 epitope indirect immunofluorescence in selectively permeabilized cells. HHAT constructs containing a C-terminal FLAG epitope tag and an internal V5 epitope tag at the indicated loops were transfected into HeLa cells plated on 96-well imaging plates. Cell membranes were either permeabilized with 0.2% Triton X-100 (TX100) or with 0.04% digitonin (Dig). Permeabilization with digitonin maintains the ER membrane intact, whereas permeabilization with Triton X-100 fully permeabilizes all membranes of the cell. FLAG and V5 epitopes were stained with specific primary antibodies, followed by secondary antibodies with 555-nm (red) or 488-nm (green) excitation wavelengths, respectively. To control for the selective permeabilization of the ER membrane, untransfected cells were selectively permeabilized and stained for Calnexin using two different antibodies, one that binds to an epitope on the luminal N terminus of the protein and another that bind to an epitope on the cytosolic C terminus of the protein (I). Only two conditions are shown, for the V5 epitope in the N terminus of the protein (II) and in predicted loop 1 (III). The N and C termini of HHAT were both cytosolic (II), therefore the FLAG epitope will always be stained regardless of the detergent used for permeabilization. Images were then analyzed using Volocity image analysis software to determine the colocalization coefficient of the two channels. The insets show a higher magnification of the indicated regions. The histogram (IV) shows mean Manders' coefficients (MC) for colocalization of the red (555-nm) channel with the green (488-nm) channel for different HHAT mutants and for the Calnexin control (n > 40 cells, data are mean ± S.D.). High Manders' coefficients indicate better colocalization of FLAG-tagged proteins with V5-tagged proteins. Values less than 0.5 indicate low colocalization. Identical exposures and image normalization for both permeabilizations ensure a fair side-by-side comparison. The bottom panels of II and III illustrate the positions of the stained epitopes. Images are examples of each condition from at least three independent experiments. Scale bars = 15 μm.