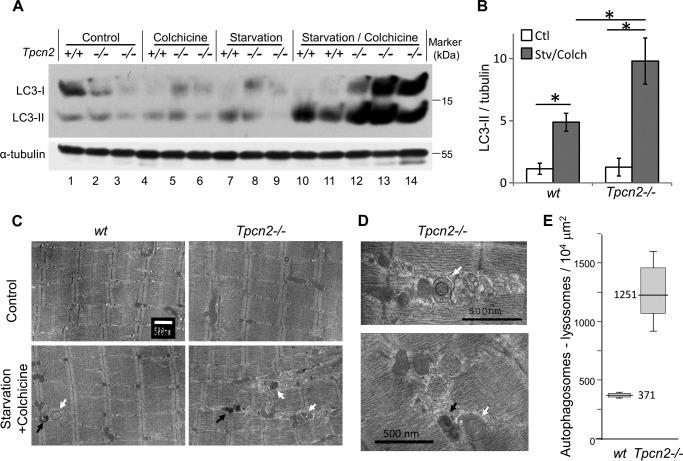
FIGURE 3.
Exacerbated autophagosome accumulation in Tpcn2−/− skeletal muscle in response to microtubule inhibitor during starvation. A and B, immunoblots of LC3 and α-tubulin in TA muscle homogenates (100 μg/lane) of 5-month-old wild type (+/+) and Tpcn2−/− (−/−; as denoted on the top of the lanes) mice under regular fed condition (control; lanes 1–3), after a 2-day treatment with either colchicine alone (lanes 4–6) or starvation alone (lanes 7–9), or a combination of starvation plus colchicine (lanes 10–14). B, densitometry quantification of normalized LC3-II levels (over tubulin) under the control condition (Ctl) or after starvation/colchicine treatment (Stv/Colch). Error bars represent S.E. C, electron micrographs of TA muscles derived from wild type and Tpcn2−/− mice. The scale bar represents 500 nm. An apparent increase in the number of autophagosomes (white arrows) and lysosomes (black arrows) was observed in the Tpcn2−/− TA muscle after starvation/colchicine treatment. D, enlarged electron micrographs from autophagic Tpcn2−/− TA muscle showing autophagosome (top panel, white arrow) and mitophagy (lower panel, white arrow). The lysosome is marked with a black arrow. E, the numbers of apparent autophagosomes plus lysosomes derived from 10–12 muscle cells/sample in wild type and Tpcn2−/− TA following starvation/colchicine-induced autophagy. Data are expressed as numbers of autophagosomes plus lysosomes over the area of 104 μm2. Error bars represent S.E. (n = 4 mice/condition).

