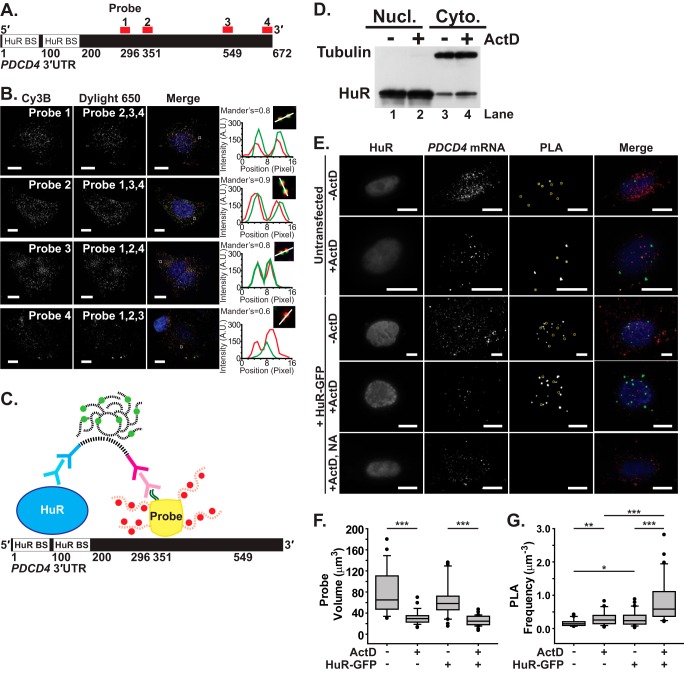
FIGURE 4.
Visualization of HuR/PDCD4 interactions in situ using FLAG-tagged probes. A, the 672-nt PDCD4 3′UTR contains two HuR-binding sites (HuR BS) within the first 200 nt. Four mRNA probes (1–4) were designed to target distinct positions within the PDCD4 3′UTR (shown in red). B, each of four PDCD4 3′UTR probes labeled with Cy3B fluorophores was delivered to MCF-7 cells along with the other three probes labeled with DyLight 650 fluorophores. Merge images of Cy3B-labeled probe (red), DyLight 650-labeled probe (green), and DAPI-stained nuclei (blue) are also shown. All image planes are represented. Magnified merge images of overlapping probes in the boxed region are shown with a profile plot of the fluorescence intensity of Cy3B (red) and DyLight 650 (green) along an intersection of the probes (white line). Scale bar, 10 μm. The mean Mander's coefficient of Cy3B and DyLight 650 probe colocalization is shown. C, schematic of the PLA, which measures the interaction between HuR and probes specific to the PDCD4 3′UTR, is shown. As described under “Experimental Procedures,” PLA was performed between HuR and FLAG-tagged (dark green lines) probes with four Cy3b-labeled (red) oligonucleotides (red dashed lines) and a NeutrAvidin core (yellow) in nucleotides 296–549 of the PDCD4 3′UTR. Anti-HuR mouse primary antibody (light blue) and anti-mouse PLA probe (dark blue) bind to HuR, whereas anti-FLAG rabbit primary antibody (light magenta) and anti-rabbit PLA probe (dark magenta) bind to FLAG. Once they are in proximity, the oligonucleotides (black dashed lines) attached to the PLA probe come together via ligation to form a template for DNA polymerase, which resulted in a coiled DNA product that can be labeled with Cy5-equivalent fluorophore (light green)-bound complementary DNA strands (black dash lines). D, MCF-7 cells treated with vehicle control or ActD for 90 min were subjected to subcellular fractionation (as described under “Experimental Procedures”) and subsequent immunoblotting with HuR and tubulin antibody. A distinct enrichment of HuR is observed in the cytoplasm upon ActD treatment. Nucl, nuclear; Cyto, cytoplasmic. E, HuR, PDCD4 mRNA and PLA between HuR and PDCD4 mRNA were imaged in untransfected and HuR-GFP-transfected MCF-7 cells exposed to (+ActD) or unexposed to (−ActD) actinomycin D. MCF-7 cells transfected with HuR-GFP and exposed to ActD received PDCD4 mRNA probes with NeutrAvidin lacking the FLAG tag (NA) and were used as a negative control. PLA punctae that are less than 2 μm in diameter have been marked with yellow circles. Merge images of HuR (blue), PDCD4 mRNA (red), and PLA between HuR and PDCD4 mRNA (green) are shown. All image planes are represented. Scale bar, 10 μm. F, probe volume (μm3) measured for each untransfected and HuR-GFP-transfected cell exposed or unexposed to ActD (untransfected, n = 46 cells; untransfected + ActD, n = 125; HuR-GFP-transfected, n = 51; HuR-GFP transfected + ActD, n = 62). G, PLA frequency normalized to the probe volume (μm−3) for each cell. * represents p ≥ 0.025, p < 0.05; ** represents p ≥ 0.001, p < 0.025; *** represents p < 0.001 (one-way ANOVA with Dunn's method).

