
FIGURE 4.
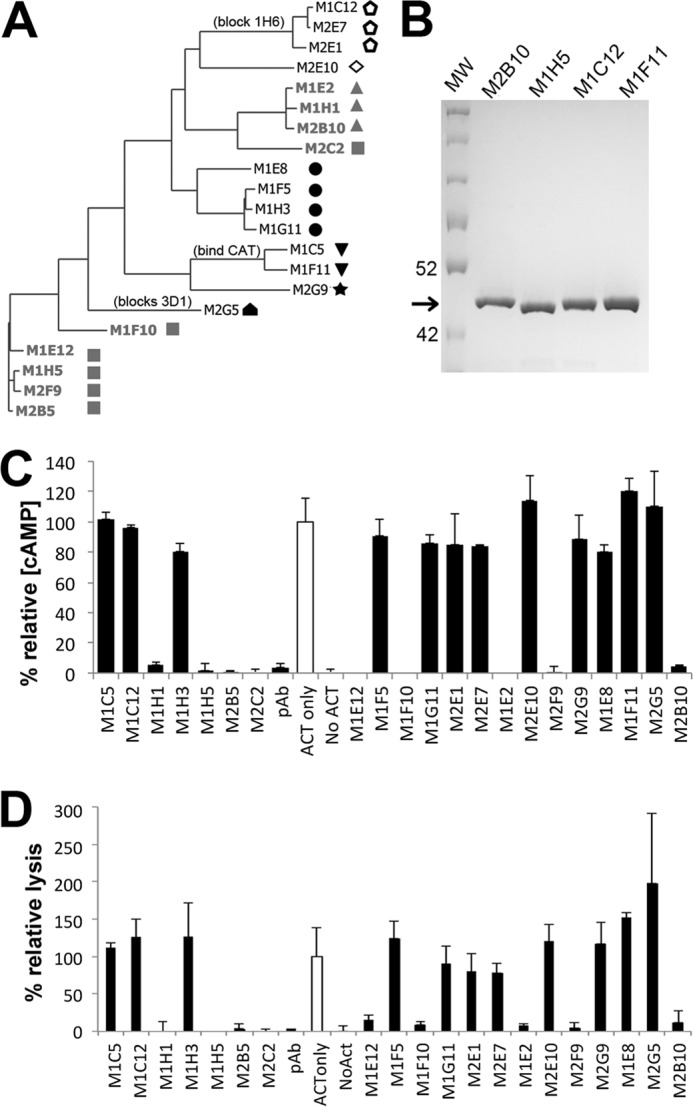
ACT immunization induces a diverse antibody response. A, phylogenetic tree depicting antibody sequence relatedness was generated using the light and heavy variable region amino acid sequences. Neutralizing scAbs are colored gray, with unique shapes denoting recognition of distinct epitopes among this antibody group as determined by competition ELISA. Open symbols denote antibodies whose binding does not depend on the presence of calcium. Antibodies competing with previously characterized monoclonal antibodies are indicated; all antibodies bind RTX except M1C5, M1F11, and M2G5, which bind CAT400. B, representative SDS-PAGE of scAbs after purification by IMAC and Superdex S200. Arrow indicates expected size of ∼40 kDa, 2 μg each of M1F11, M1C12, M1H5, and M2B10 scAbs were loaded. C, 21 unique scAbs identified from the immune phage libraries were tested for the ability to neutralize ACT-mediated increases in intracellular cAMP concentration. ACT was incubated with a 160-fold molar excess of scAb protein before adding to J774A.1 cells. Data are reported as the percent relative cAMP, calculated from the total cAMP concentration in the cellular lysate as determined by cAMP ELISA, divided by the protein concentration of the lysate, and normalized to control cells treated only with ACT (open bar). Error bars indicate range of duplicate assays. D, 21 scAbs were evaluated for their ability to rescue J774A.1 macrophages from ACT-induced lysis, using a similar protocol as for cAMP neutralization. Cell lysis was measured via lactate dehydrogenase release using the Cytotox 96 kit (Promega), normalized to control cells treated only with ACT (empty bar), and reported as the percent relative lysis. Error bars indicate standard deviation of triplicate assays.