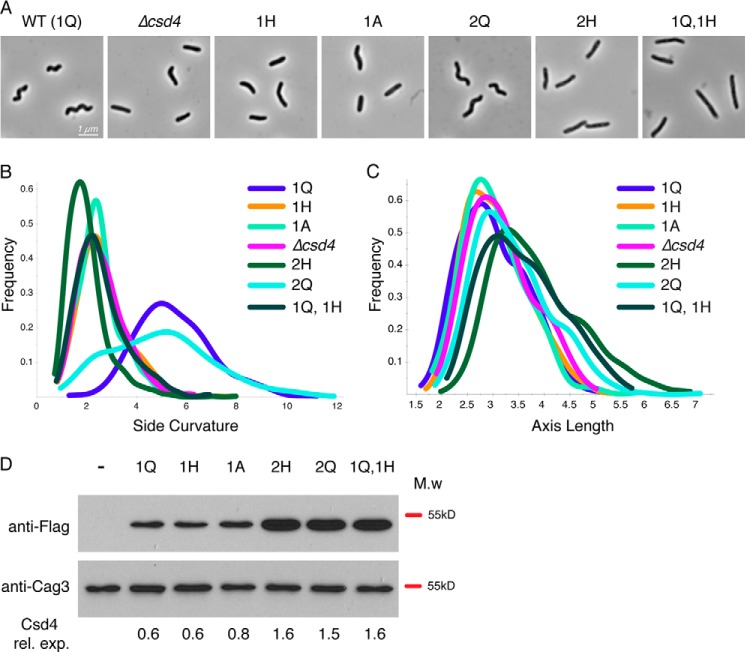
FIGURE 8.
Complementation and overexpression analysis of Csd4 active site variants. Strain labels indicate the copy number (1 or 2) and amino acid residue at position 46 (Q, A, or H) of csd4–3x-Flag. Strains with two copies have one copy at the native locus and the second copy at the rdxA locus. The strains used were (−) LSH100 WT (no 3x-Flag tag), KBH54 (Δcsd4), KBH19 (1Q), KBH33 (1H), KBH42 (1A), KBH60 (2H), KBH65 (2Q), and KBH66 (1Q, 1H). A–C, 1000× phase contrast images of wild-type (A) and csd4 mutant H. pylori (B and C) smooth histograms displaying population cell curvature (x axis, B) and population axis length (x axis, C) as a density function (y axis). D, Western blot analysis of Csd4 (detected by anti-Flag M2 antibody, predicted molecular mass of 48 kDa) and Cag3 (periplasmic protein loading control, predicted molecular mass is 55 kDa). Equivalent amounts of cell extract based on optical density of the culture were loaded for each strain. ImageJ software was used for densitometry analysis of Csd4 variant expression relative to Cag3 and is indicated below each lane. M.w, molecular mass; rel. exp., relative expression.

