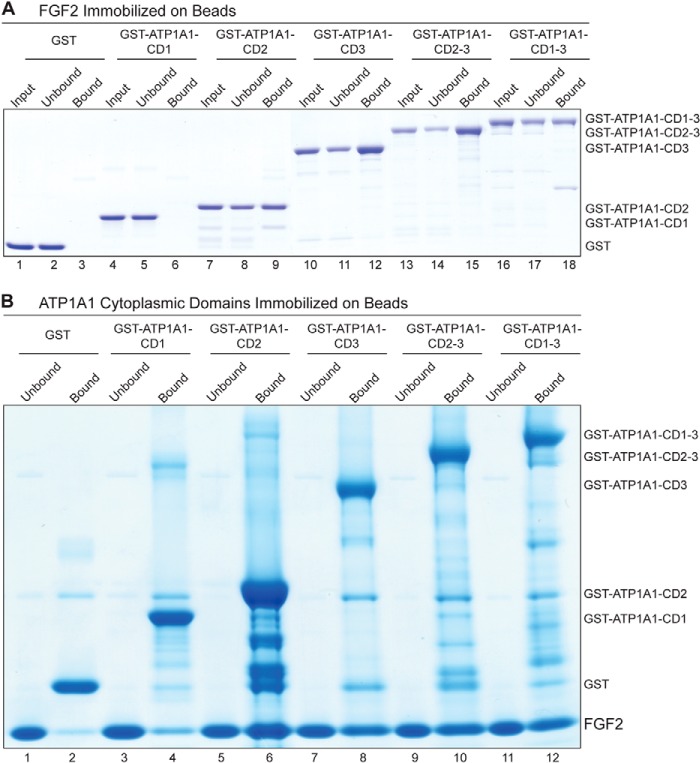
FIGURE 5.
Direct interaction between FGF2 and the cytoplasmic domain of ATP1A1 as demonstrated by biochemical pull-down experiments. A, affinity beads containing FGF2 were incubated with various variant forms of the cytoplasmic domain of ATP1A1, as indicated. The latter were used as GST fusion proteins with GST alone as a negative control (lanes 1–3). The other constructs were GST-ATP1A1-CD1 (lanes 4–6), GST-ATP1A1-CD2 (lanes 7–9), GST-ATP1A1-CD3 (lanes 10–12), GST-ATP1A1-CD2–3 (lanes 13–15), and GST-ATP1A1-CD1–3 (lanes 16–18). Bound (50% of each fraction) and unbound material (5% of each fraction) was analyzed by SDS-PAGE and Coomassie Brilliant Blue protein staining. The results shown are representative for three independent experiments. B, affinity beads containing the various variant forms of the cytoplasmic domain of ATP1A1 were incubated with soluble recombinant FGF2, as indicated. GST alone was used as a negative control (lanes 1 and 2). The other constructs were GST-ATP1A1-CD1 (lanes 3 and 4), GST-ATP1A1-CD2 (lanes 5 and 6), GST-ATP1A1-CD3 (lanes 7 and 8), GST-ATP1A1-CD2–3 (lanes 9 and 10), and GST-ATP1A1-CD1–3 (lanes 11 and 12). Bound (50% of each fraction) and unbound material (5% of each fraction) was analyzed by SDS-PAGE and Coomassie Brilliant Blue protein staining. The results shown are representative for three independent experiments.

