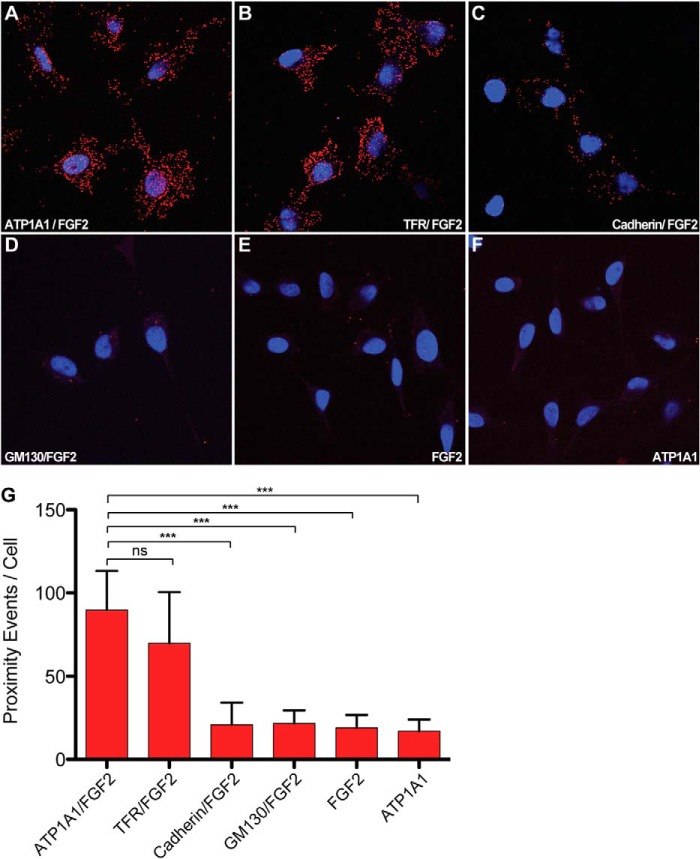
FIGURE 7.
Proximity of ATP1A1 and FGF2 analyzed in cells. To test for proximity of ATP1A1 and FGF2 in cells, the Duolink® in situ proximity ligation immunoassay (PLA®; Sigma-Aldrich) was used. HeLa cells were fixed and permeabilized with acetone. The Duolink® assay was conducted as described under “Experimental Procedures” using pairs of primary antibodies (or single primary antibodies as controls) directed against the antigens indicated. Red dots, interaction/proximity events. To visualize the nuclei of cells, DNA was stained with SYTOX® green (Invitrogen), shown in blue. A, ATP1A1 and FGF2; B, transferrin receptor (TFR) and FGF2; C, cadherin and FGF2; D, GM130 and FGF2; E, control using just one primary antibody against FGF2; F, control using just one primary antibody directed against ATP1A1; G, statistical analysis of proximity events using the Duolink® image tool software (Olink Bioscience). Data are shown as absolute counts of proximity events per cell. Mean values were calculated from four independent experiments with 30–50 cells being analyzed per individual experiment and condition. Error bars, S.D. To test whether observed differences between experimental conditions were statistically significant, an unpaired two-tailed Student's t test was performed (ns, not significant; ***, p ≤ 0.001).

